
Filters
Use report filters to limit the output of the data. Select a default filter (e.g. Stage, Record Type) or leave the filter to 'Not Set'.
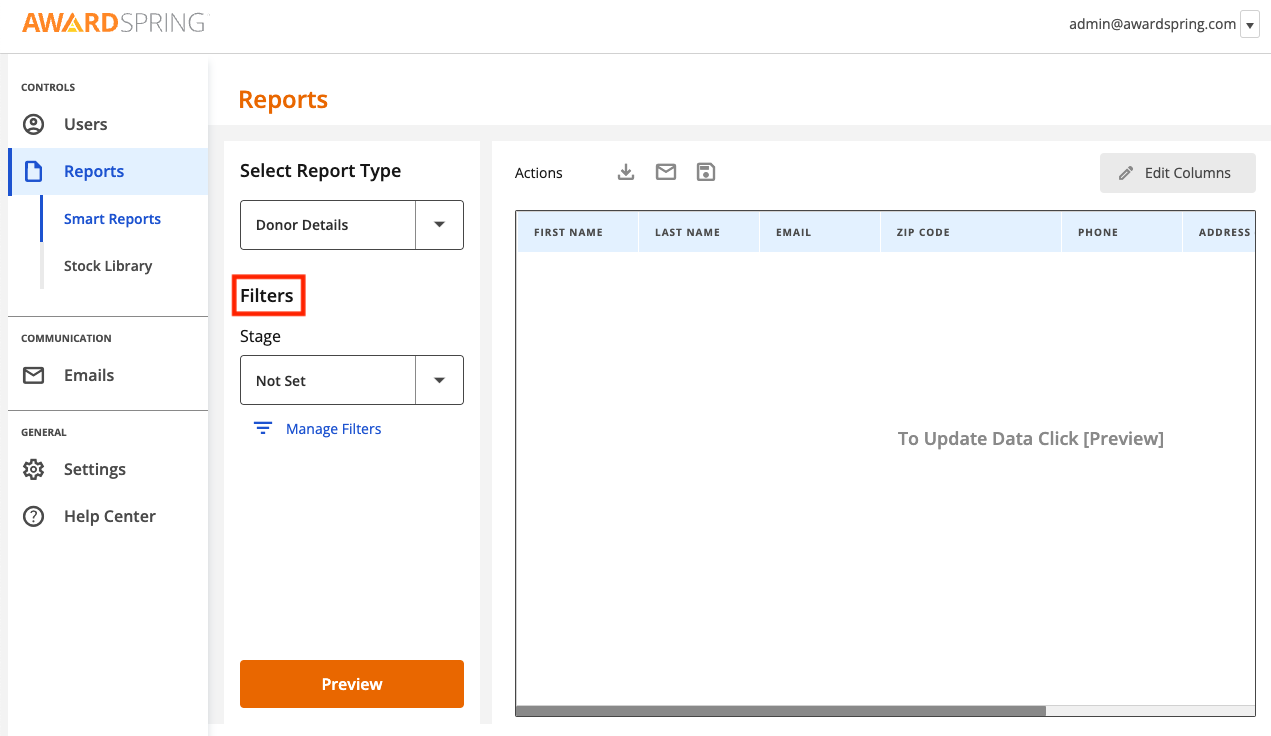
Some reports allow you to filter using custom fields. To do this, use the 'Manage Filters' option.
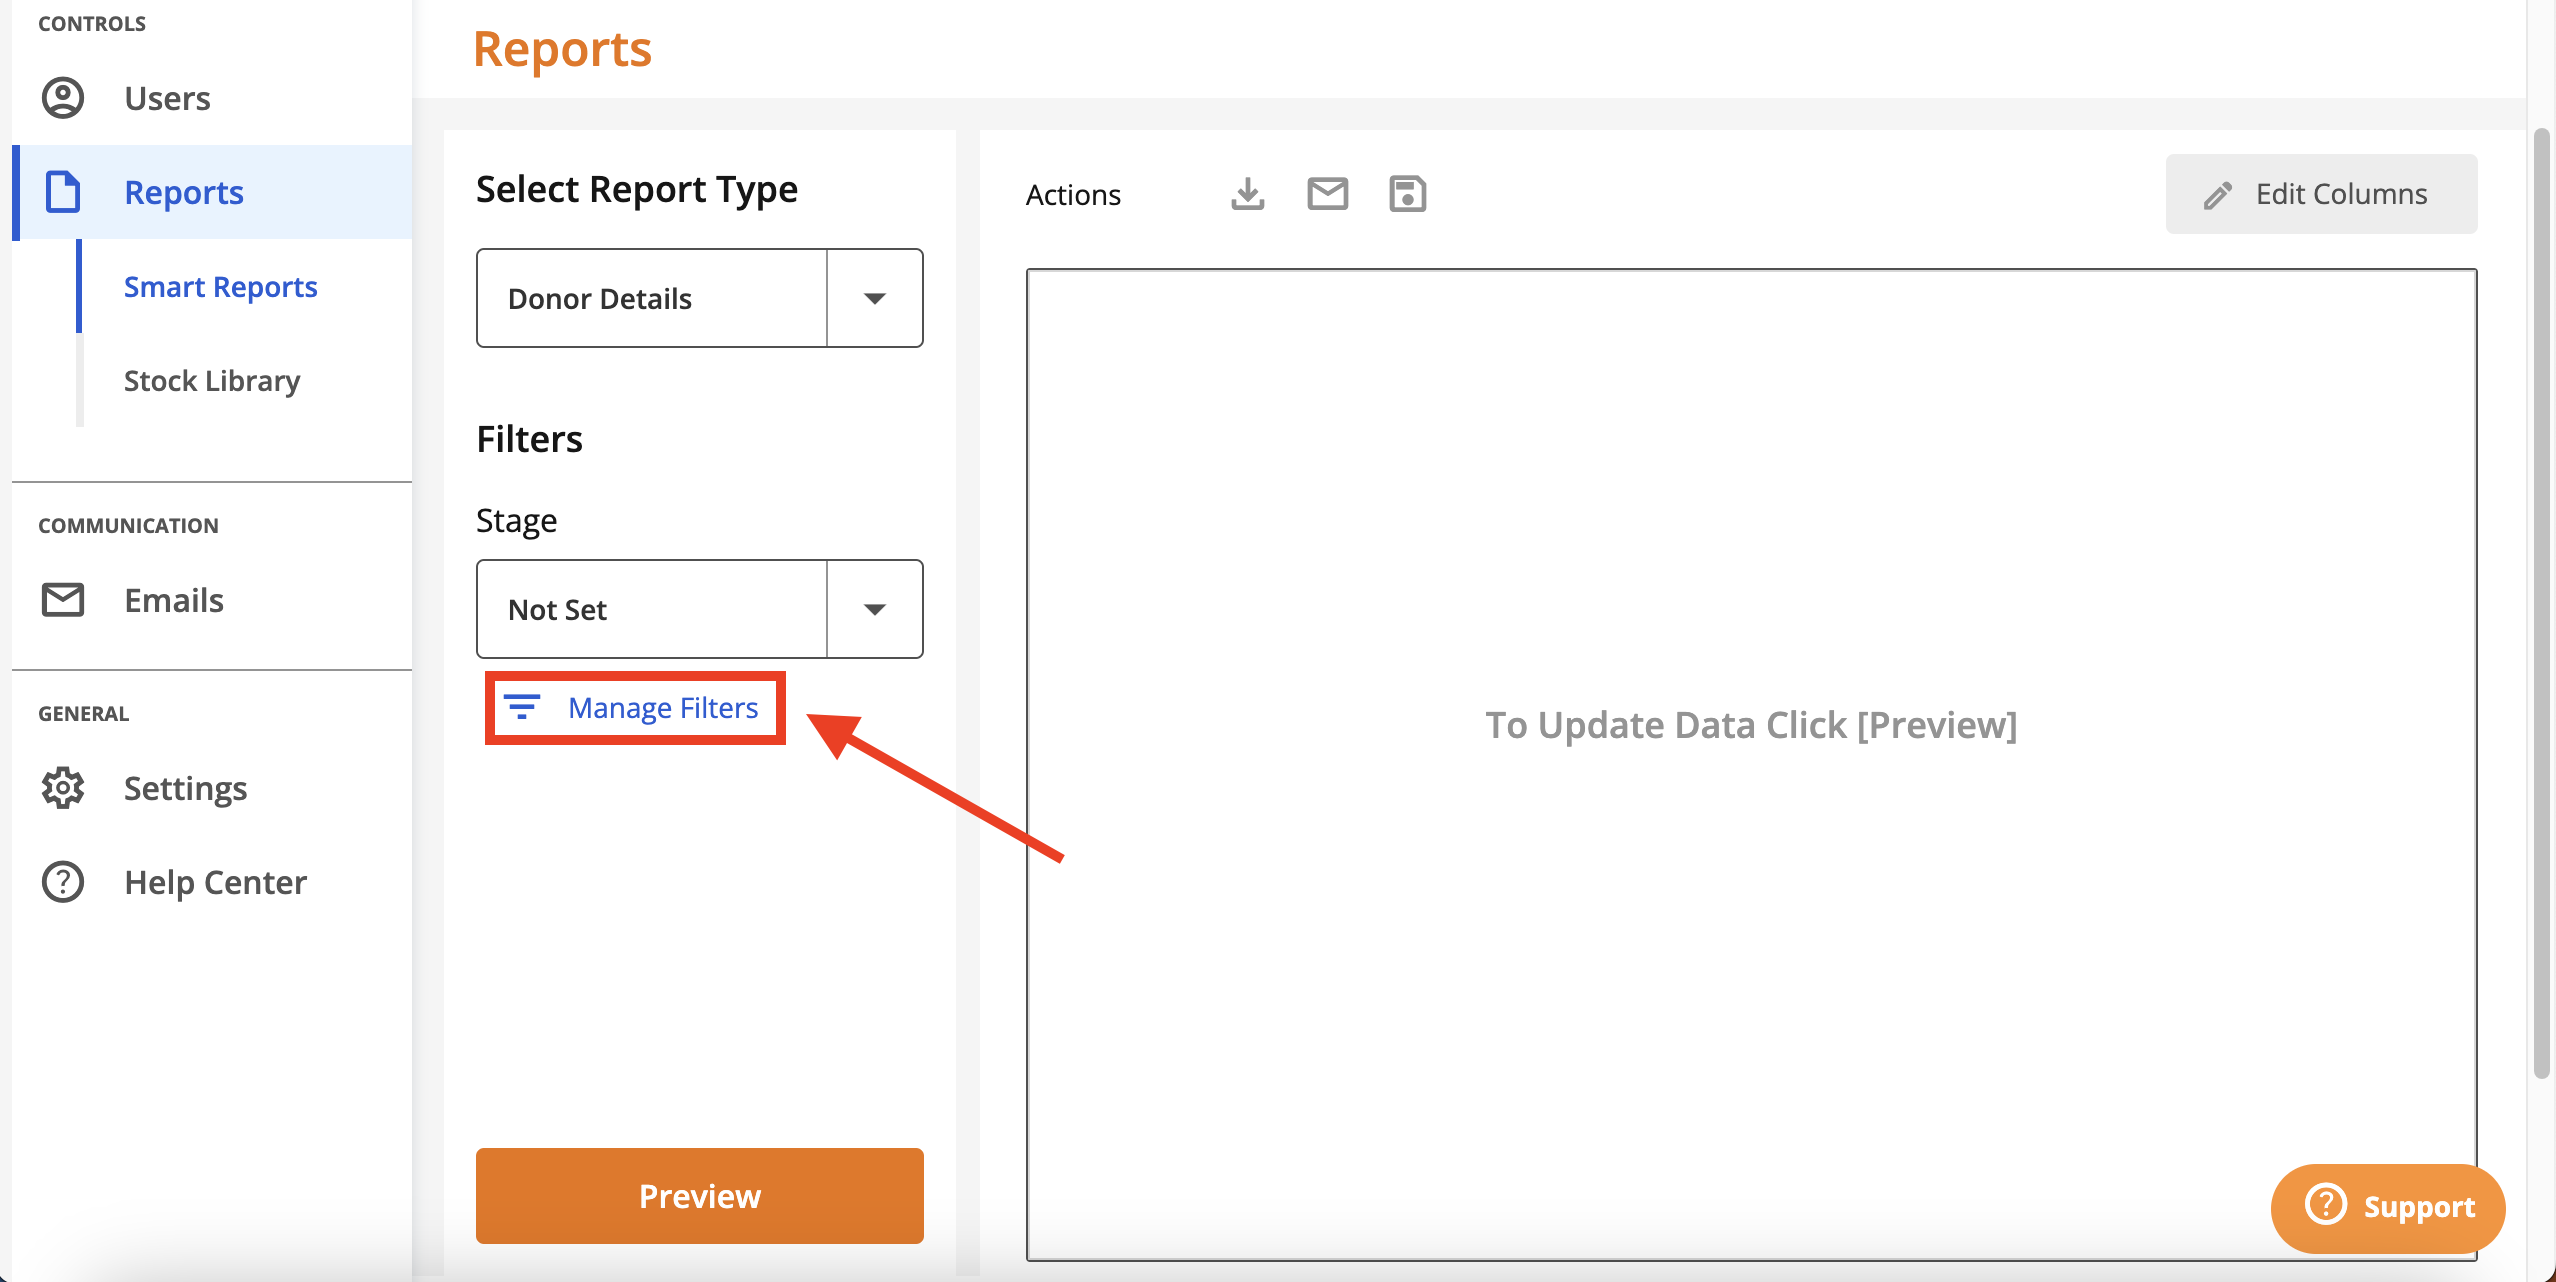
Available fields will appear in the 'Filter by:' dropdown.
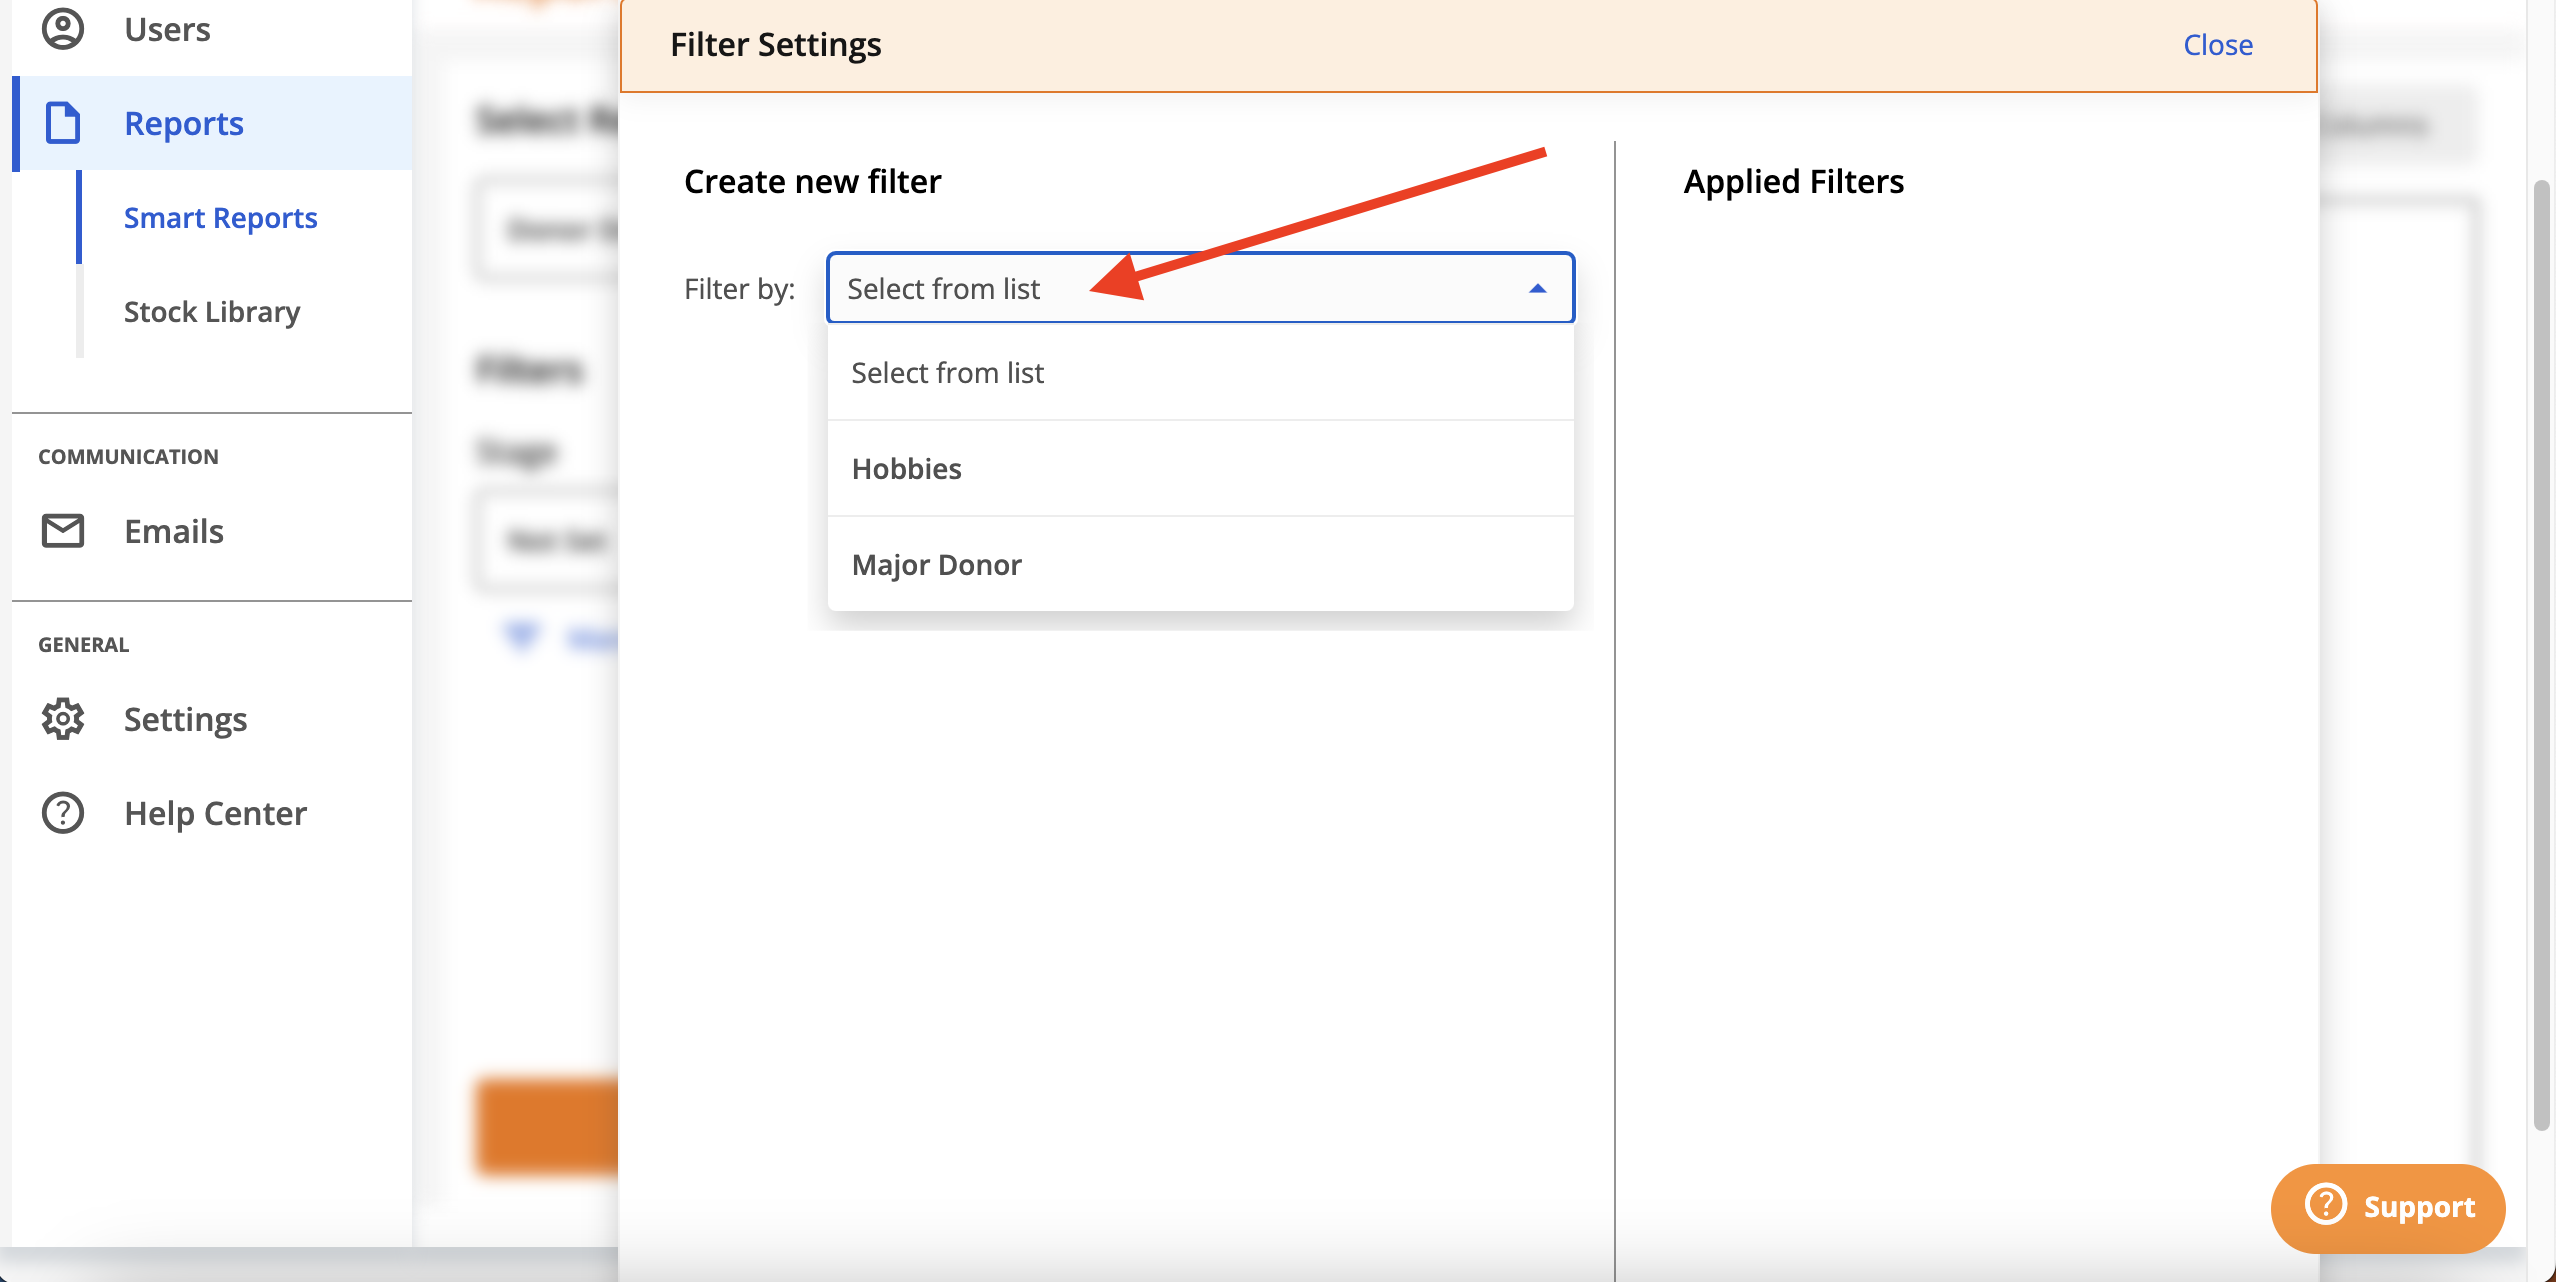
Select a field to use it as a filter and set the options. Click Apply.
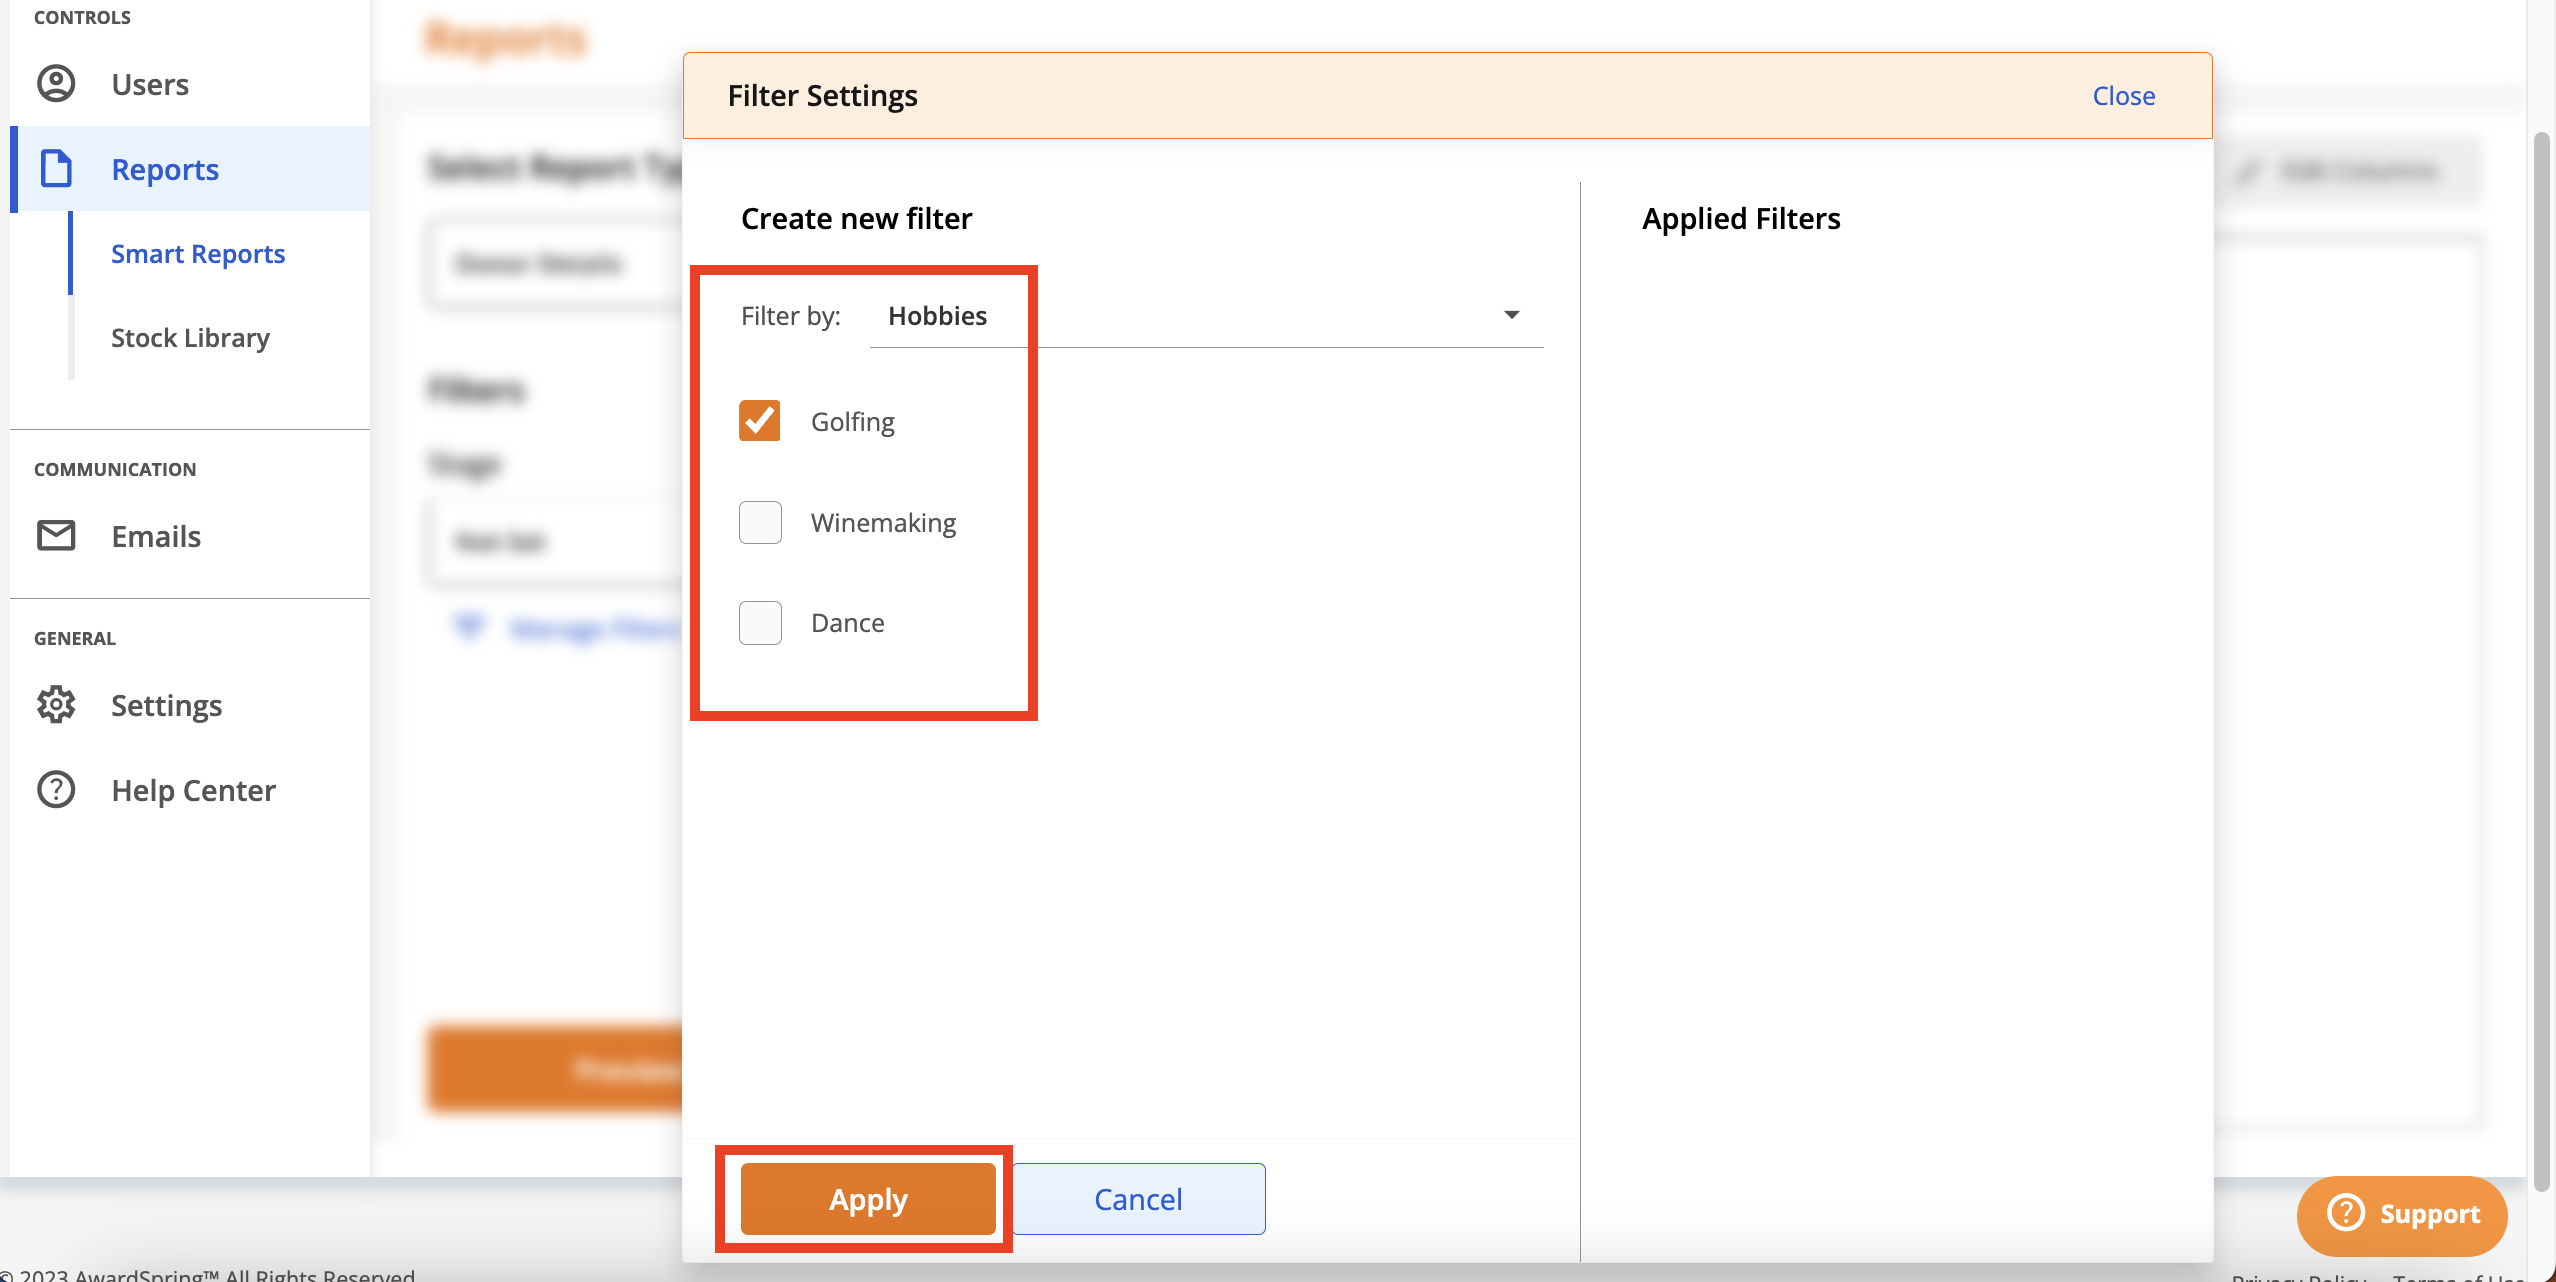
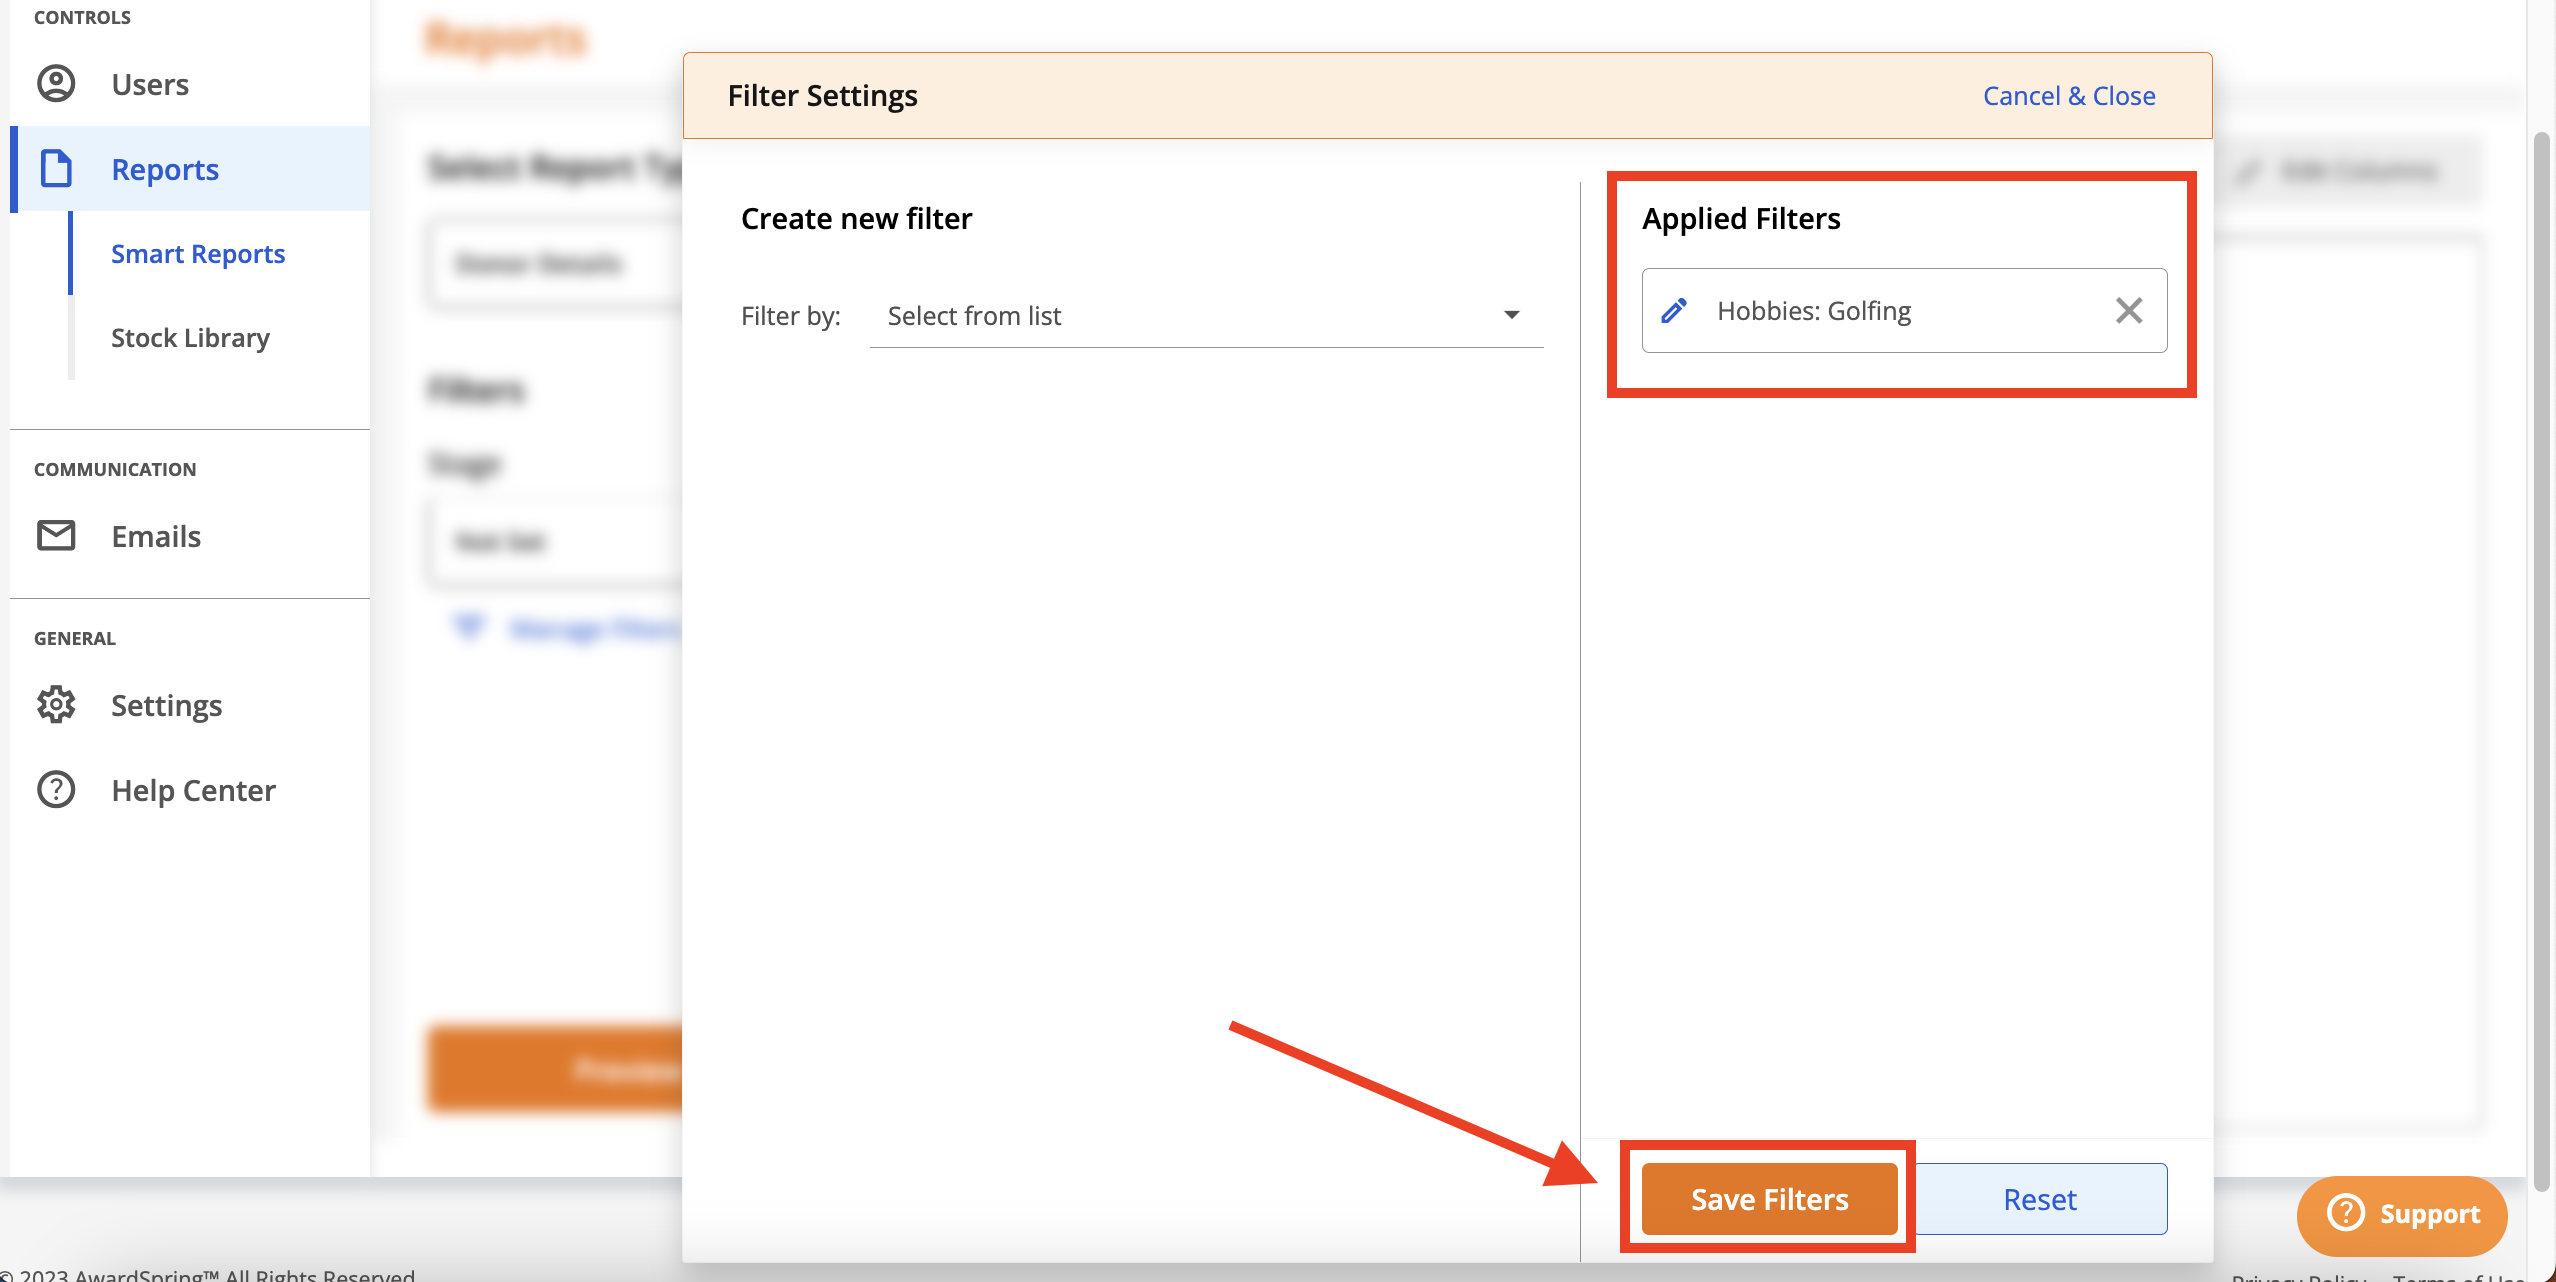
The filters will appear under the Applied Filters section to the right. Use the pencil to edit the filter, or use the X to remove the filter. Once your filters are set, click Save Filters.
You will be then be taken back to the main report screen. Click 'Preview' to preview the data that will be included in the report output.
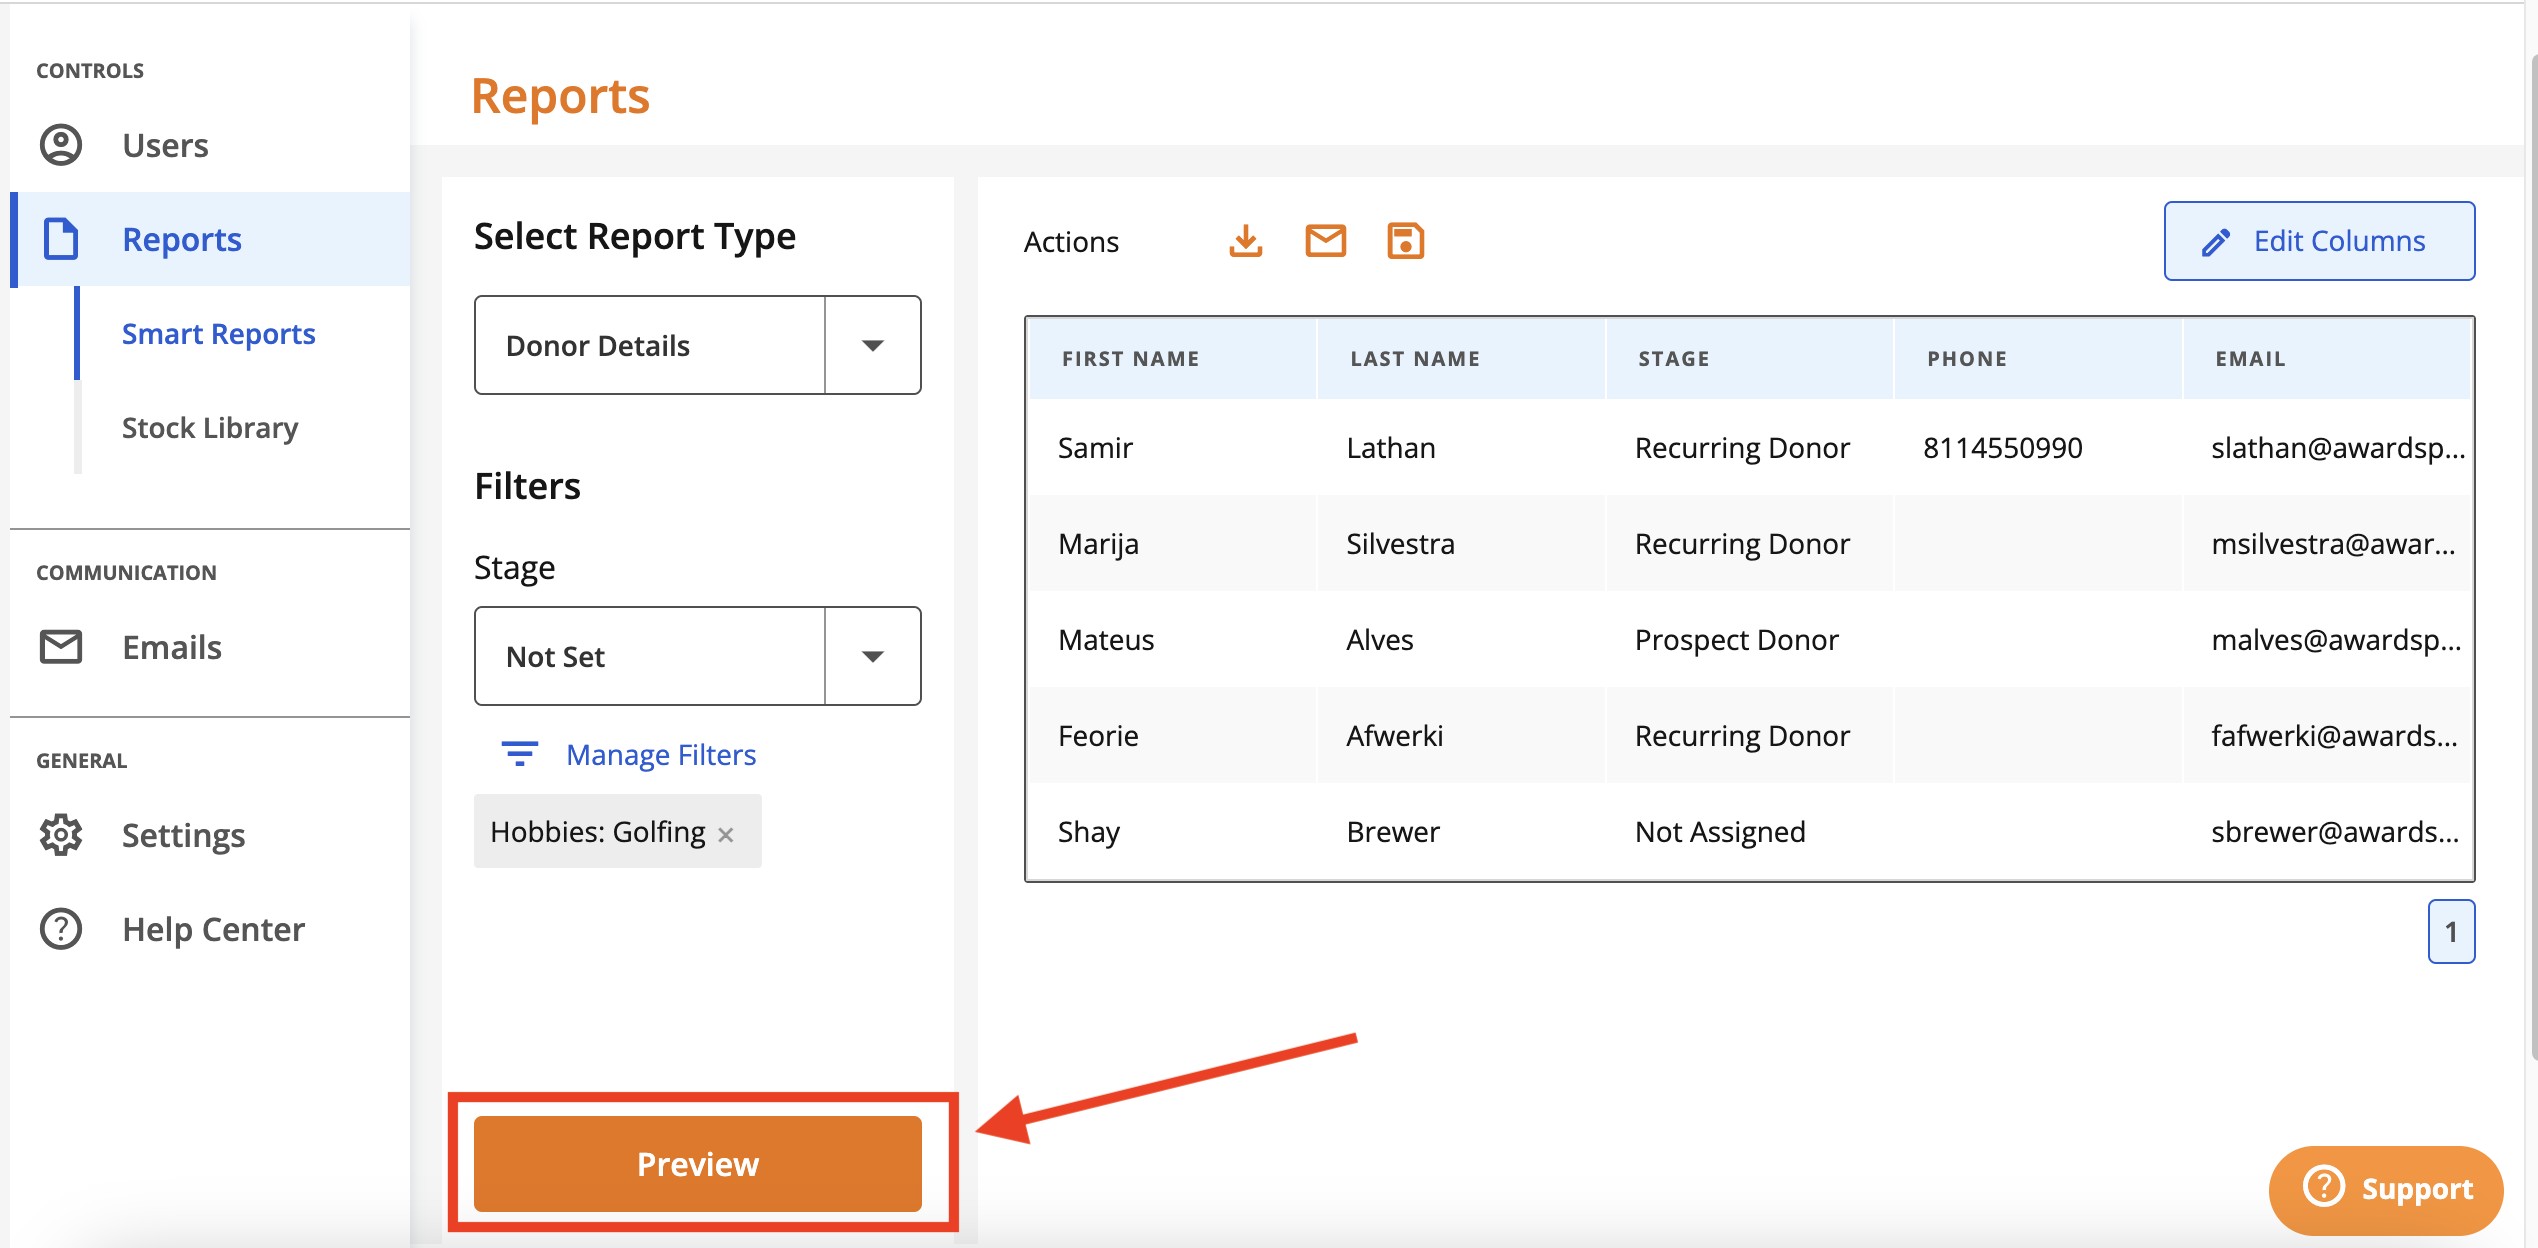
If more than 10 records are displayed, an arrow will appear next to the page numbers which allows you to preview the next page of data.
Adding/Editing Columns
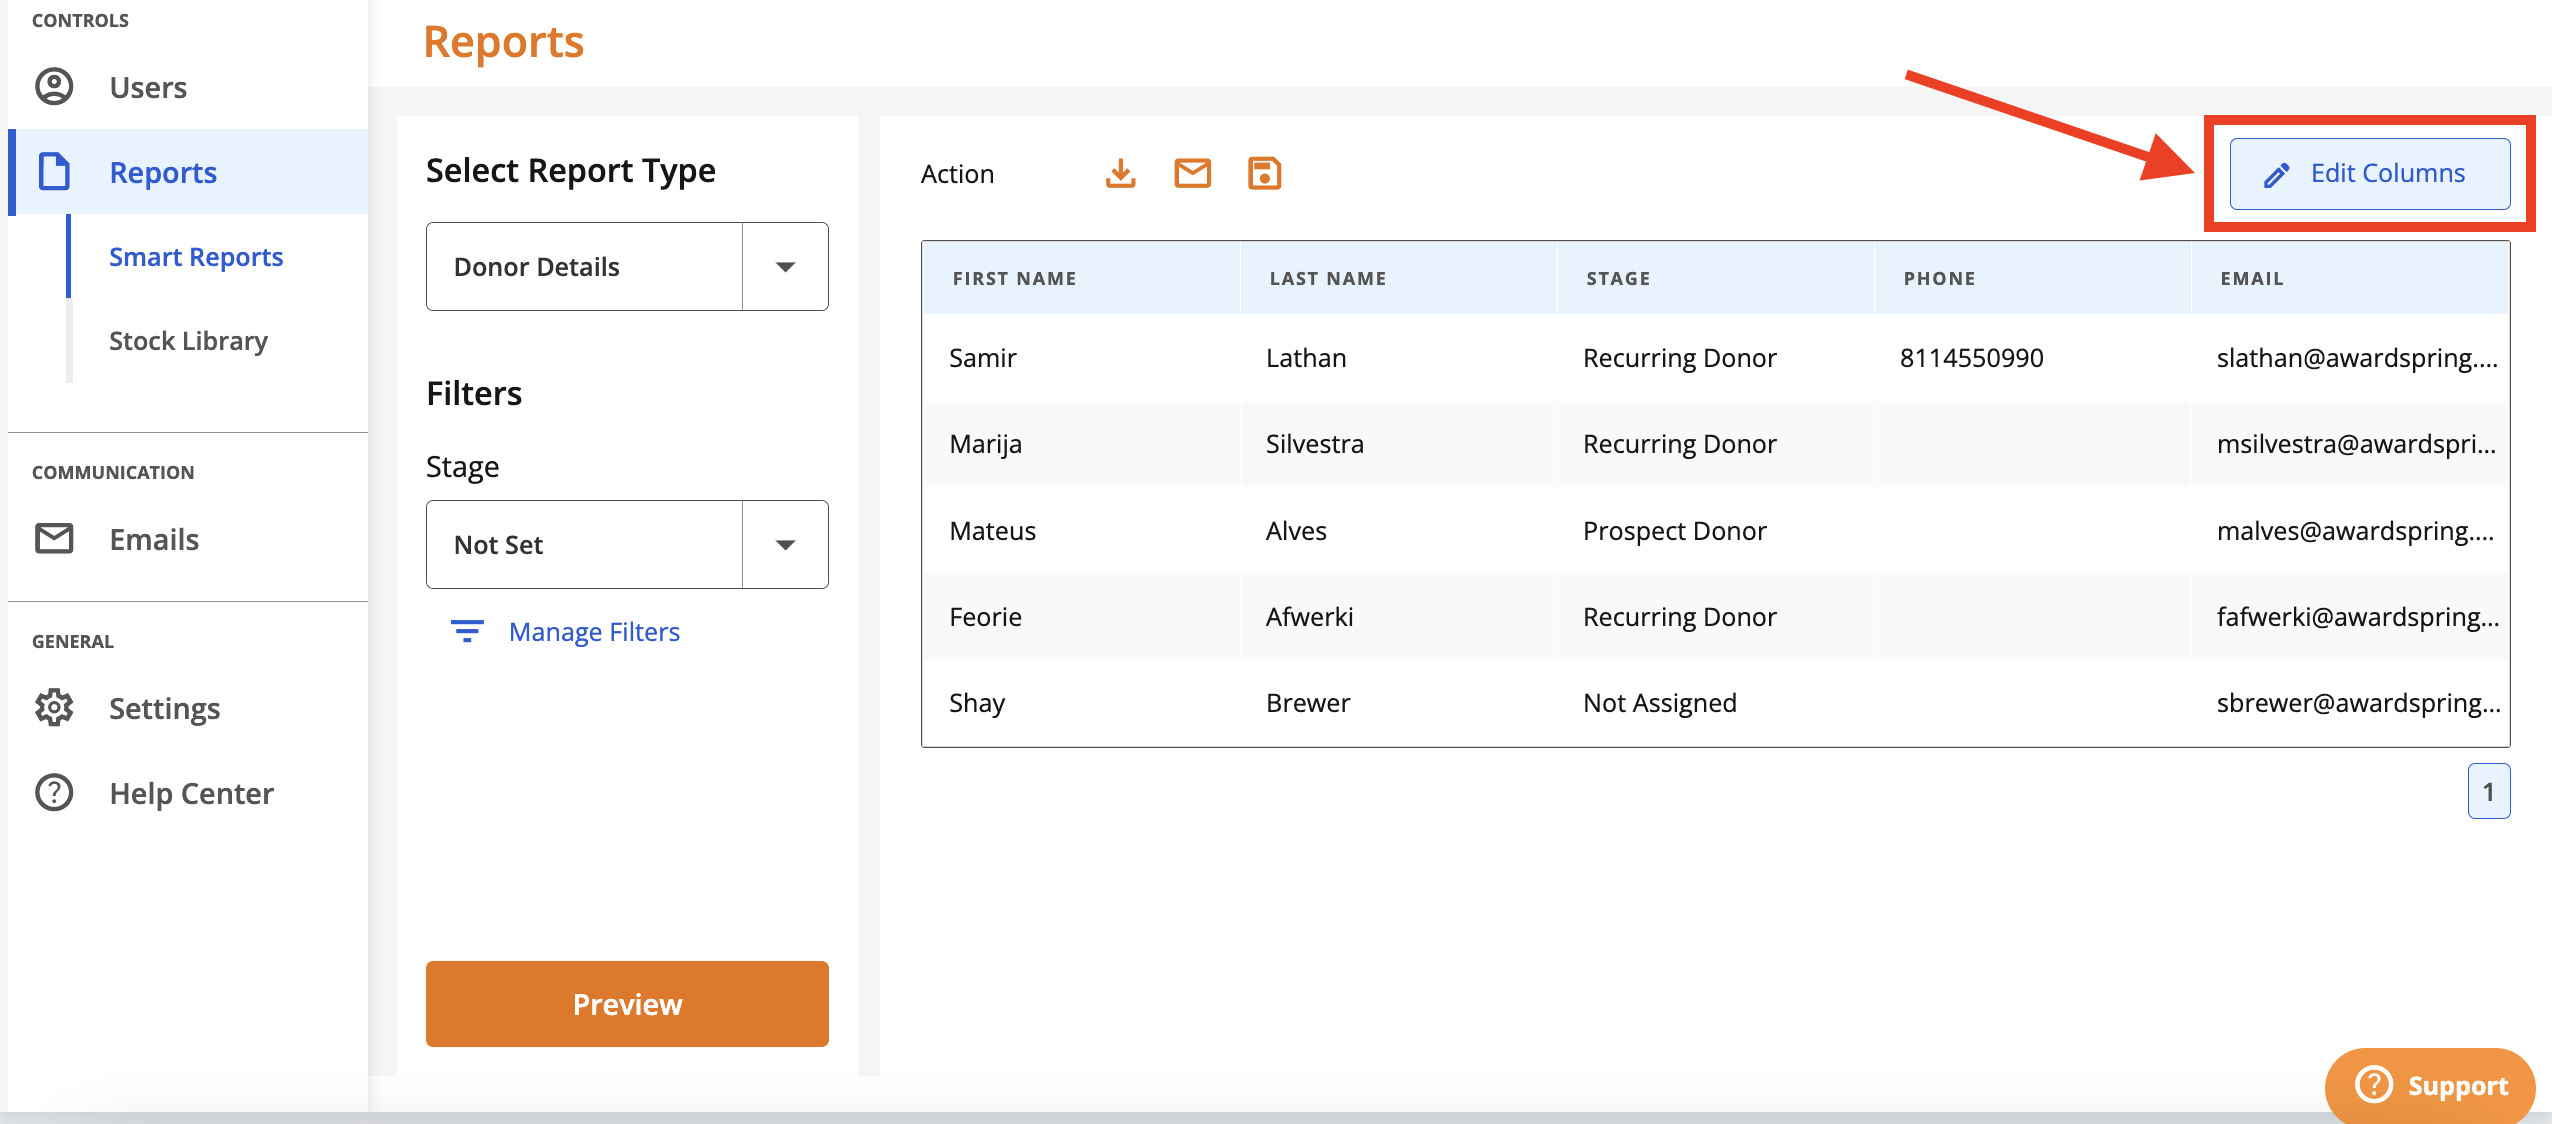
Click 'Edit Columns' to customize the data points to include in the report output.
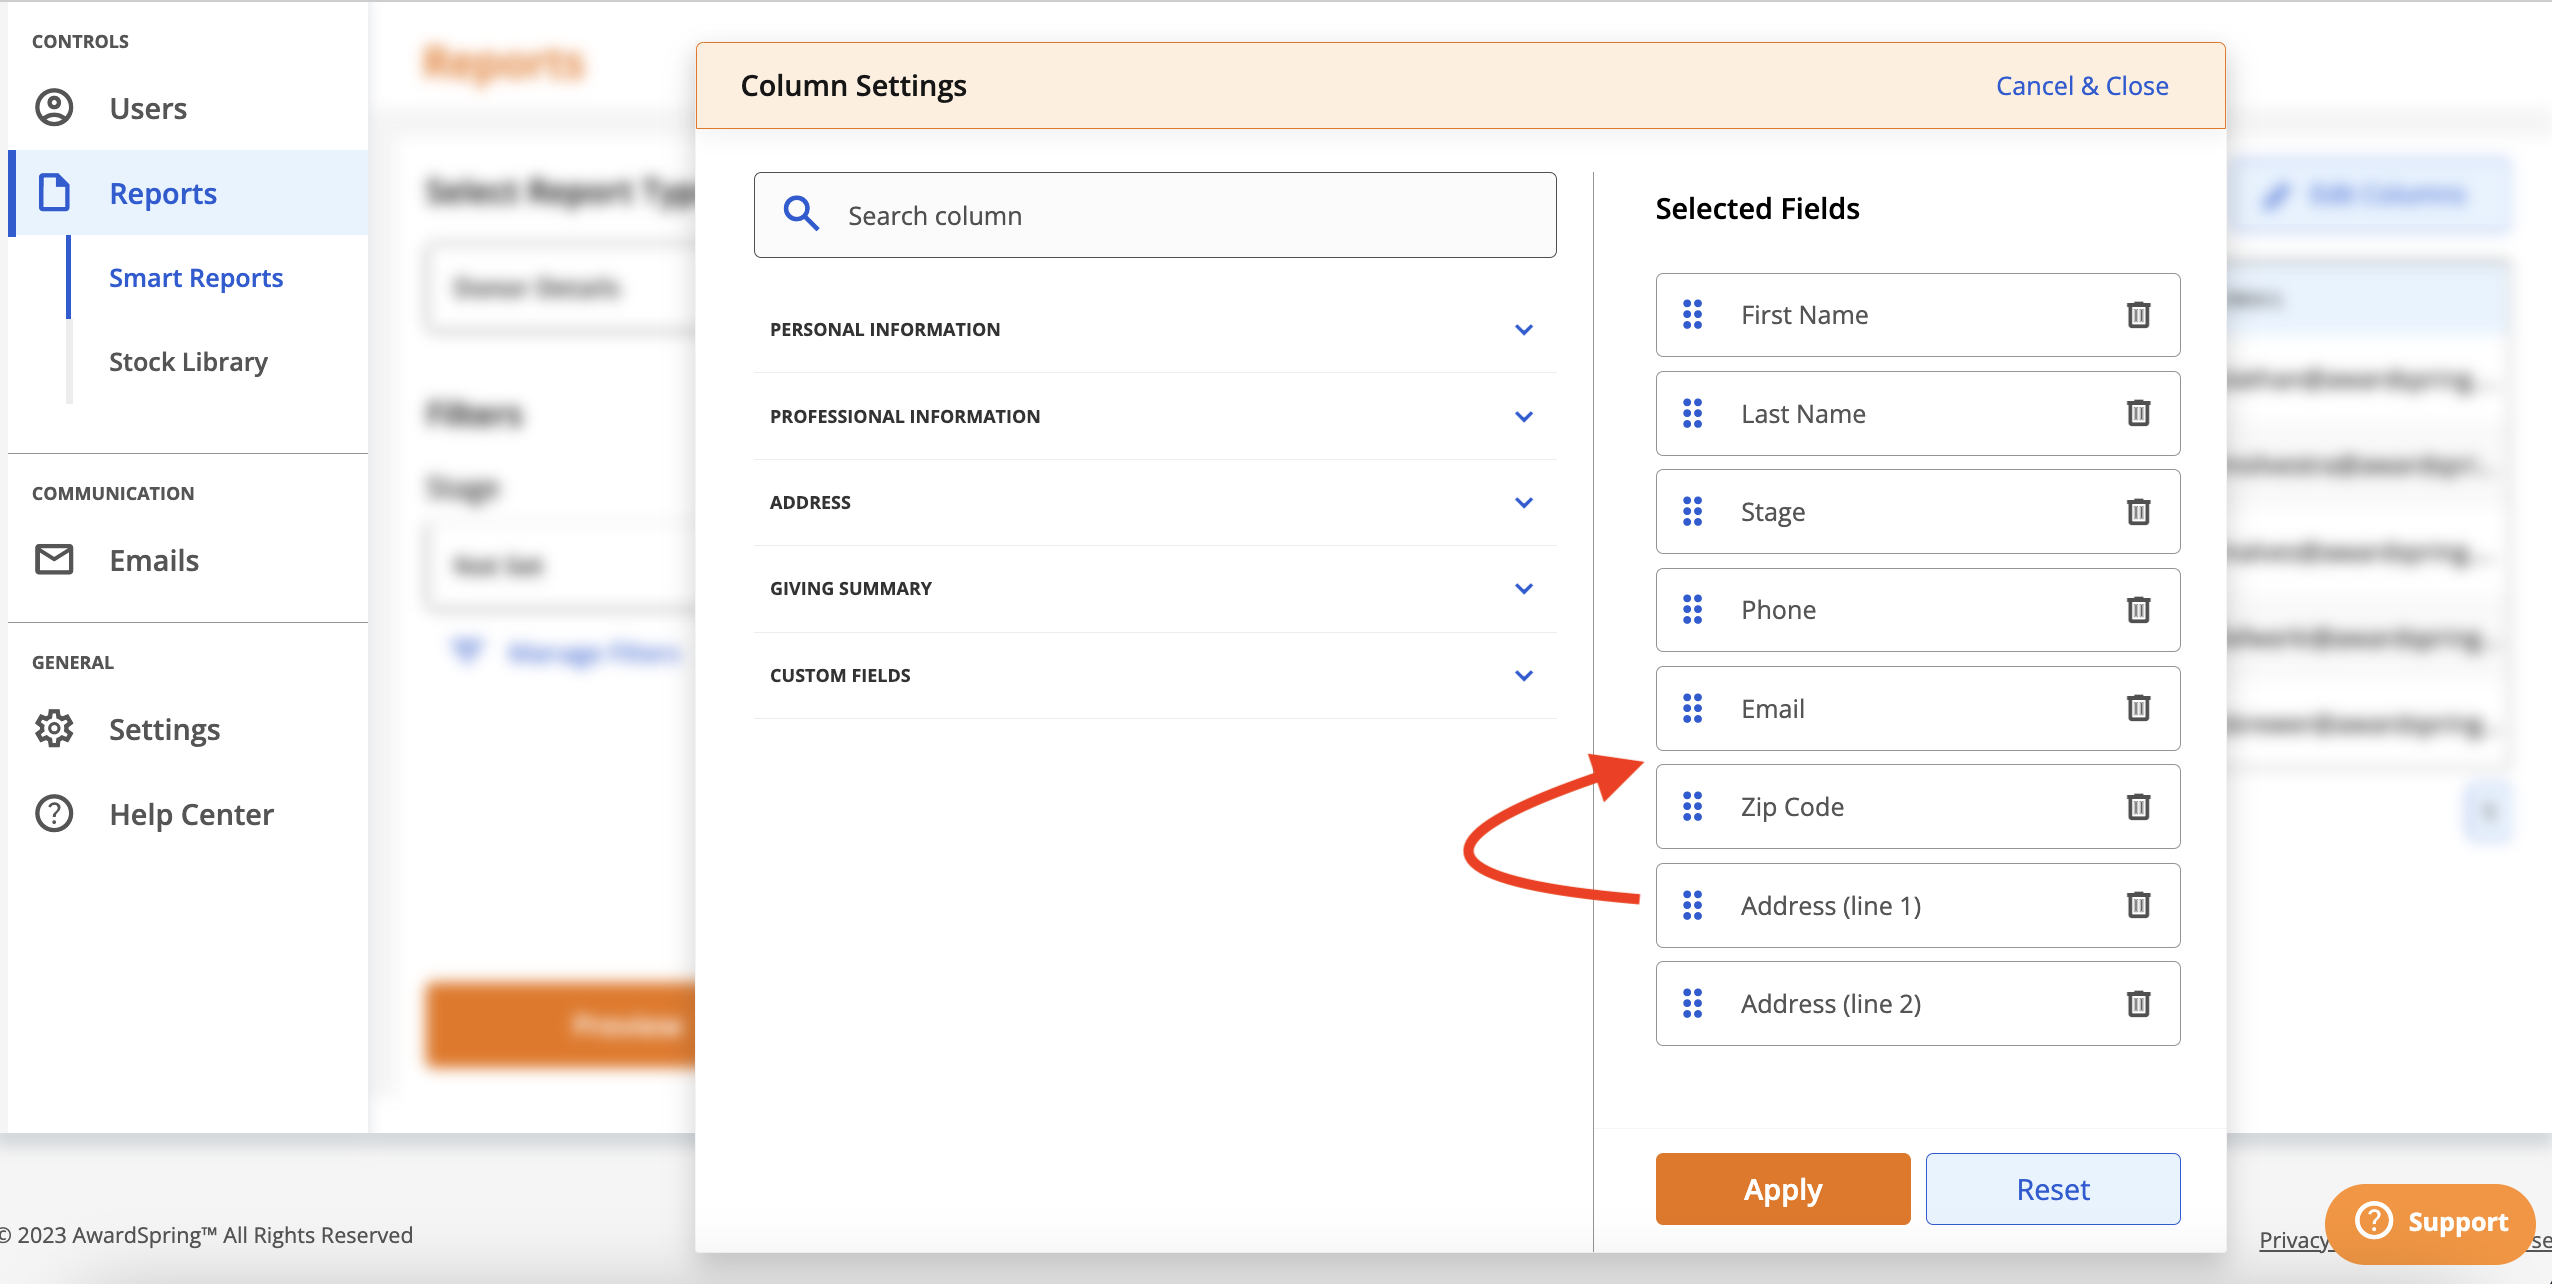
Click on a section to expand and view the available data points for that category.
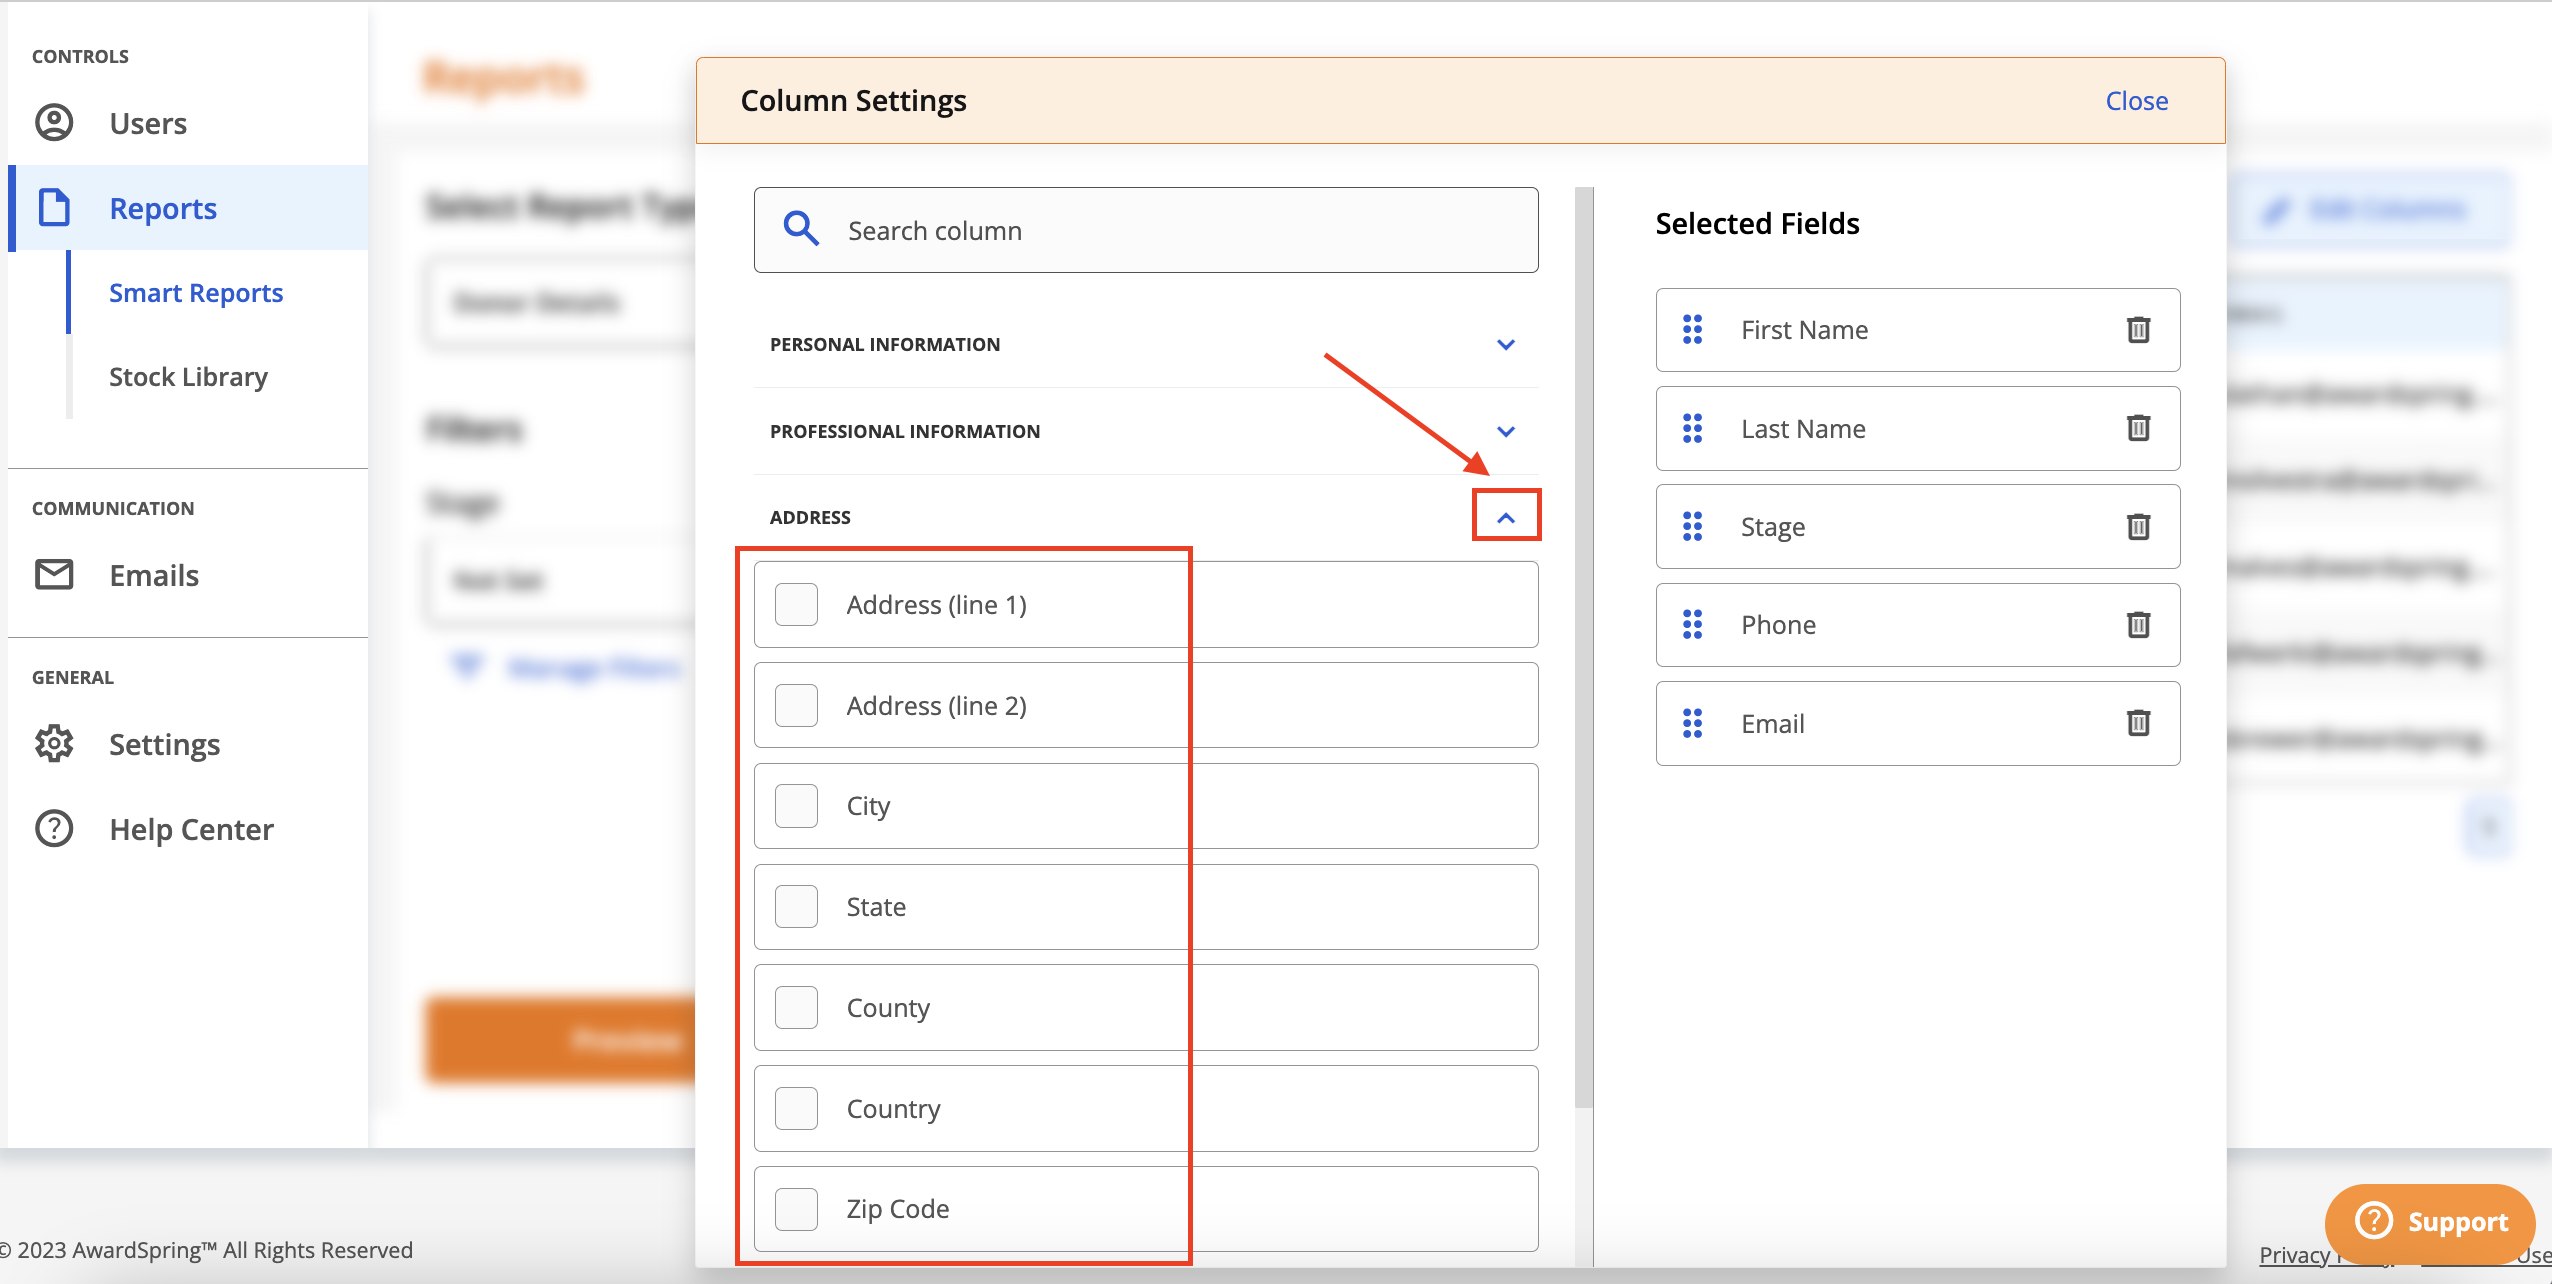
Alternatively, search all data points across all categories using a keyword.
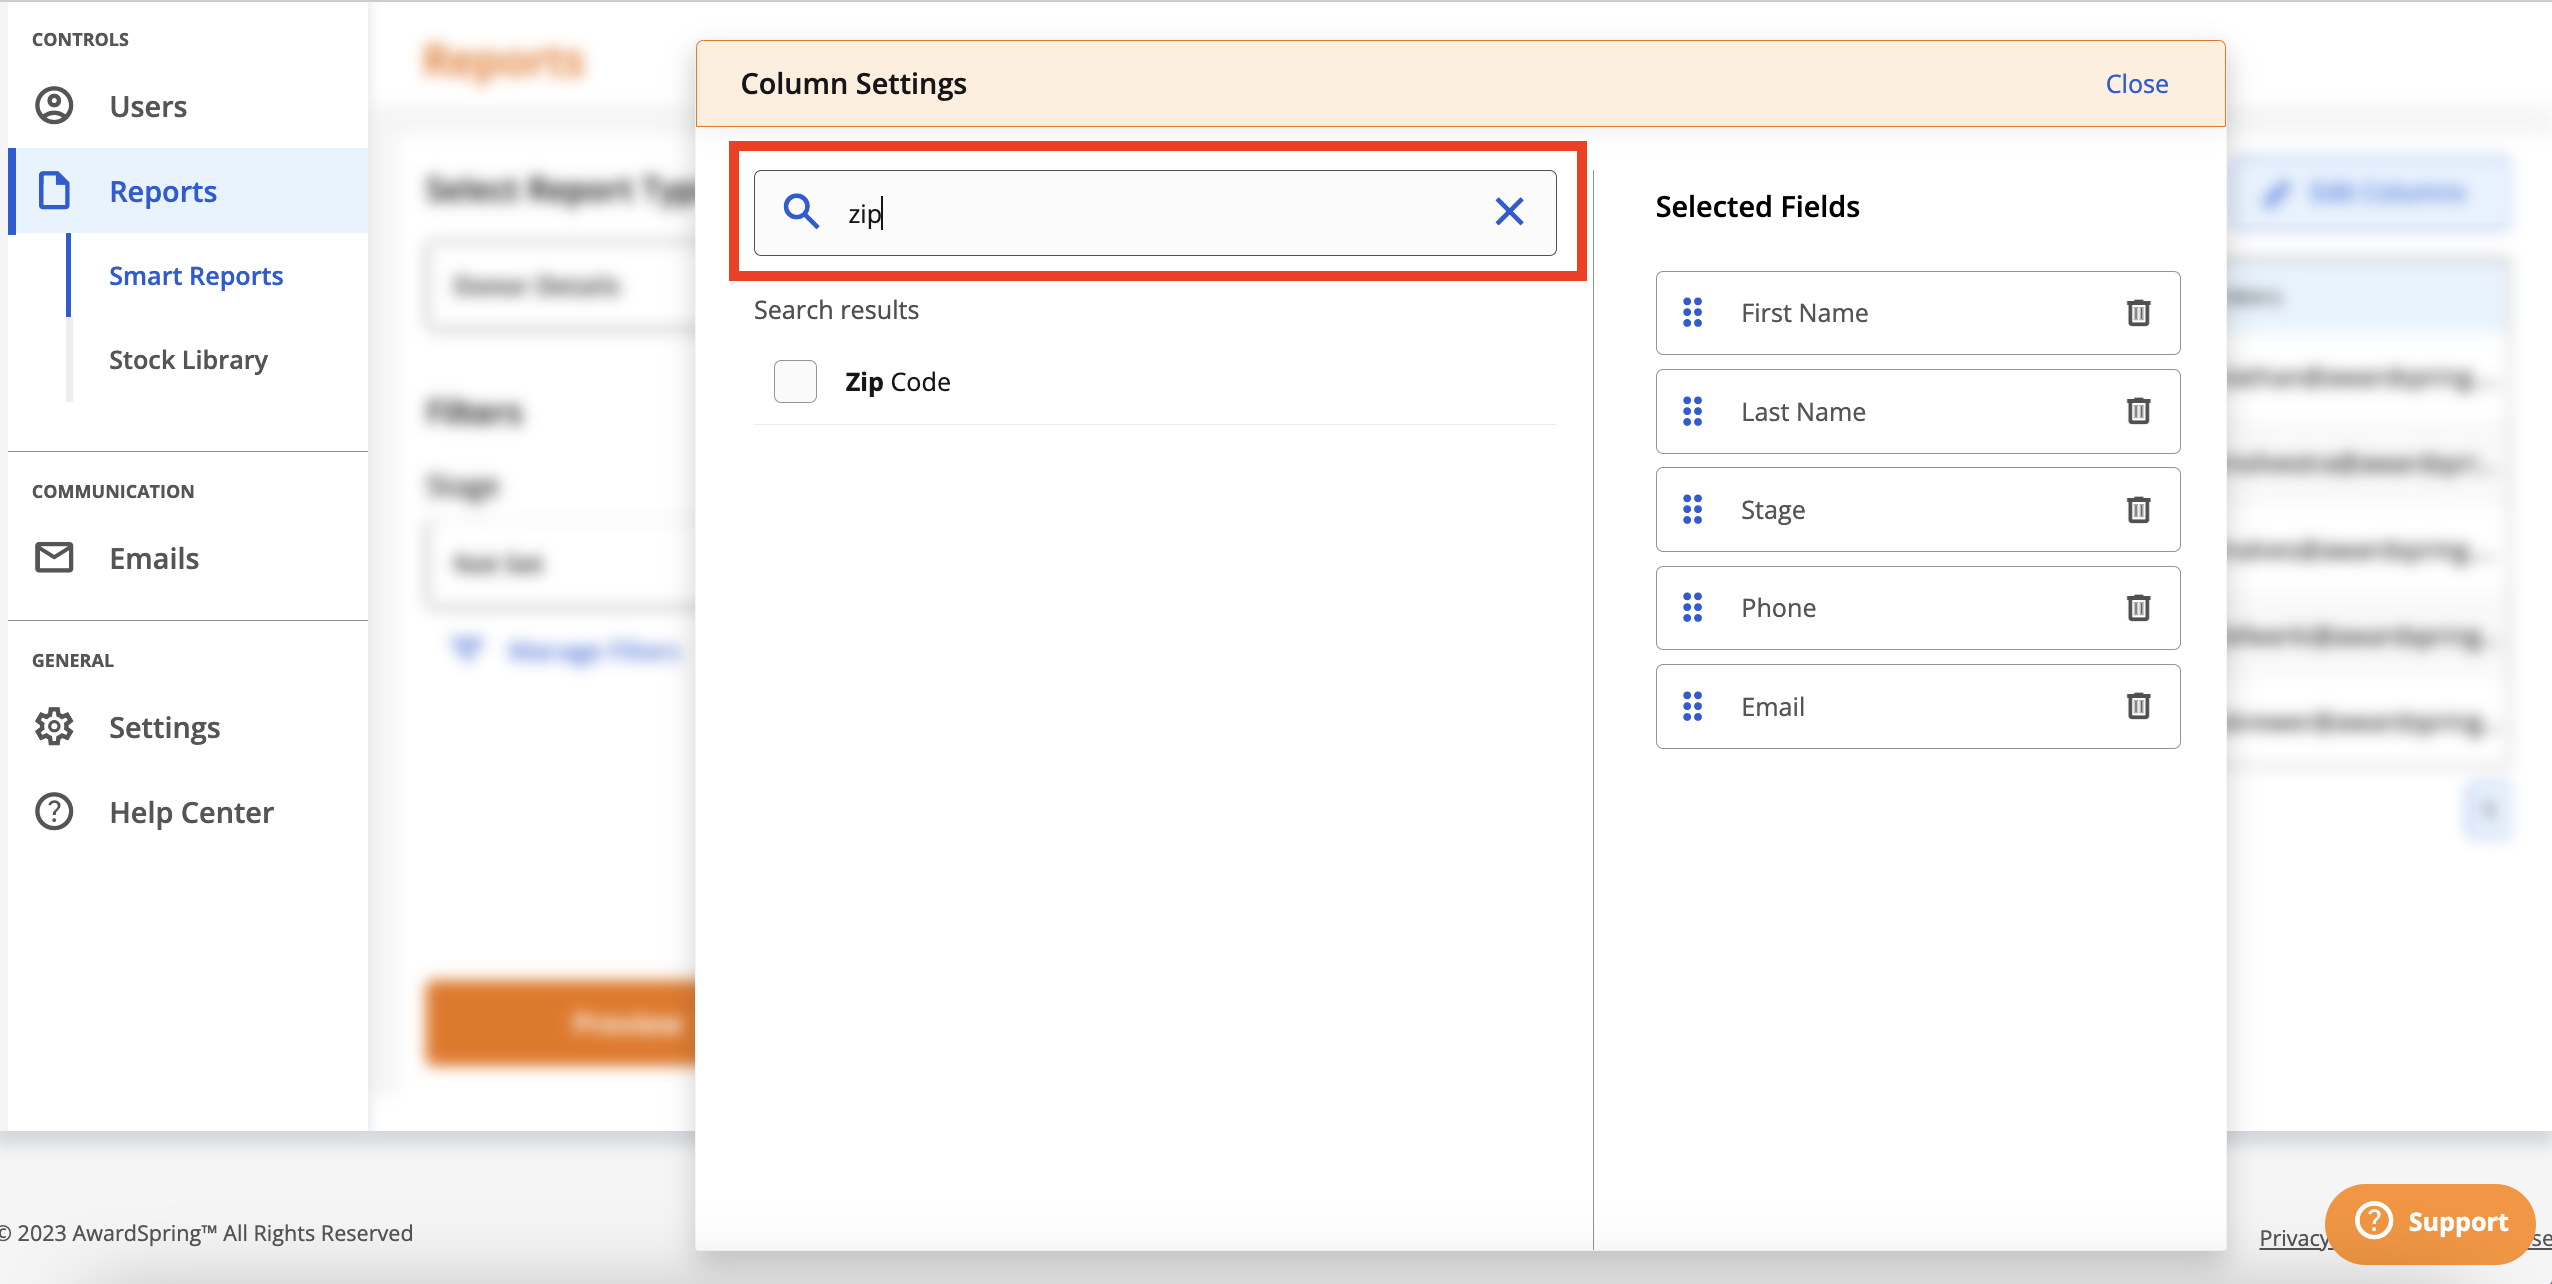
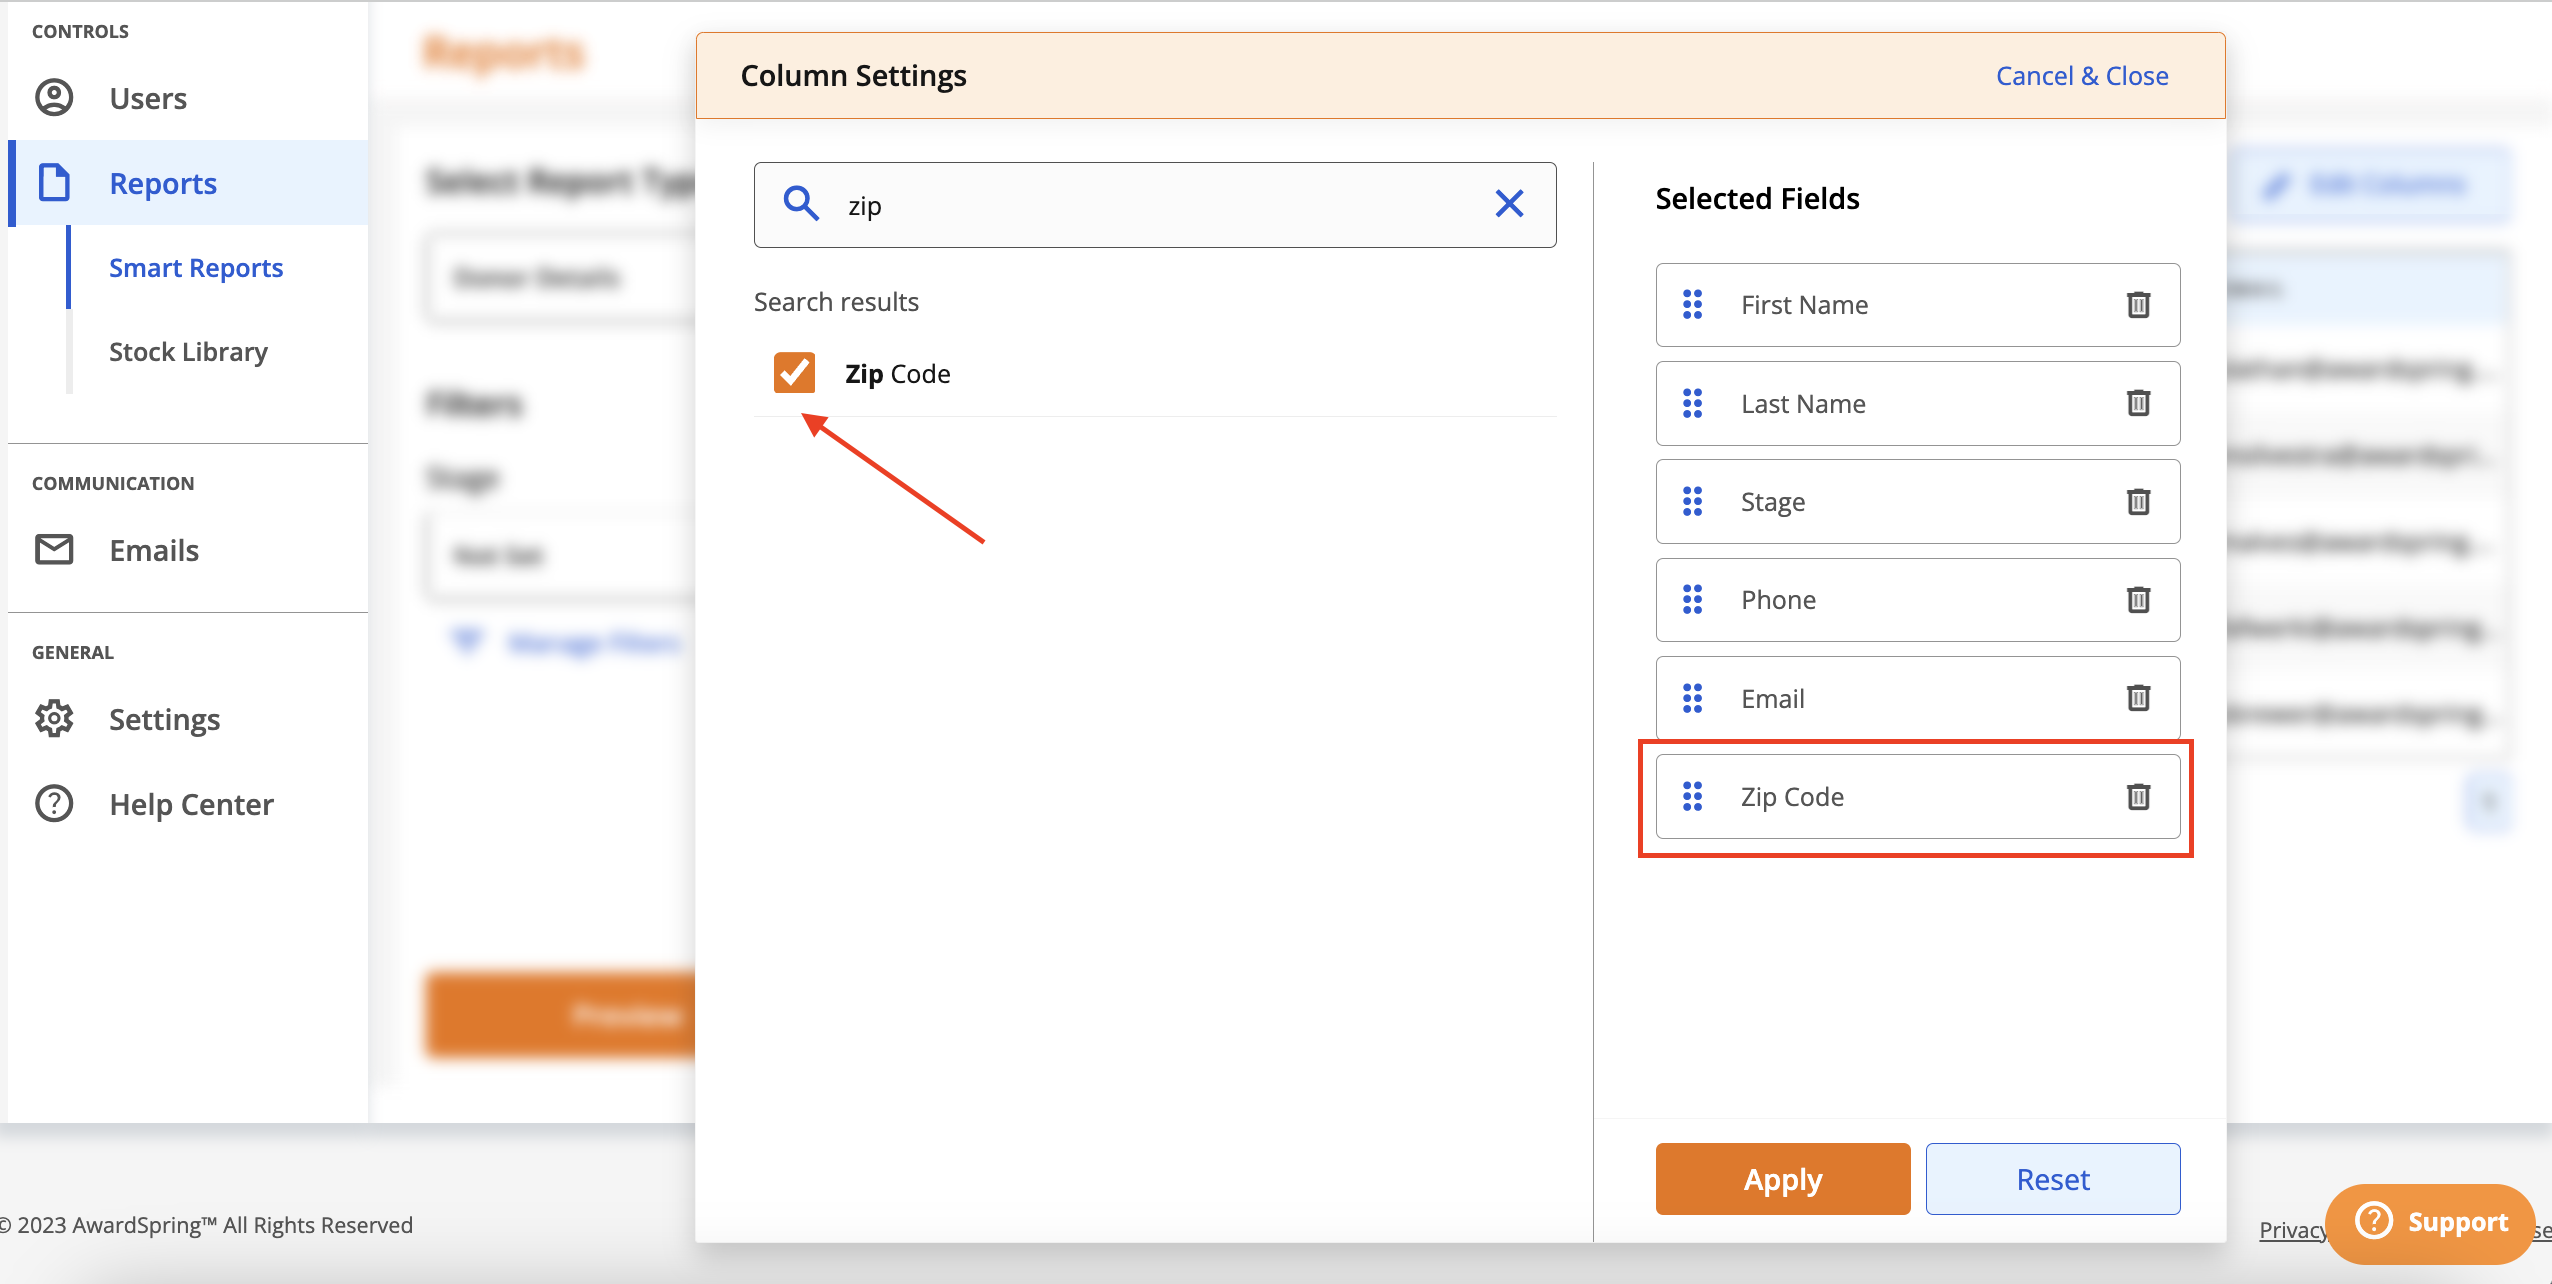
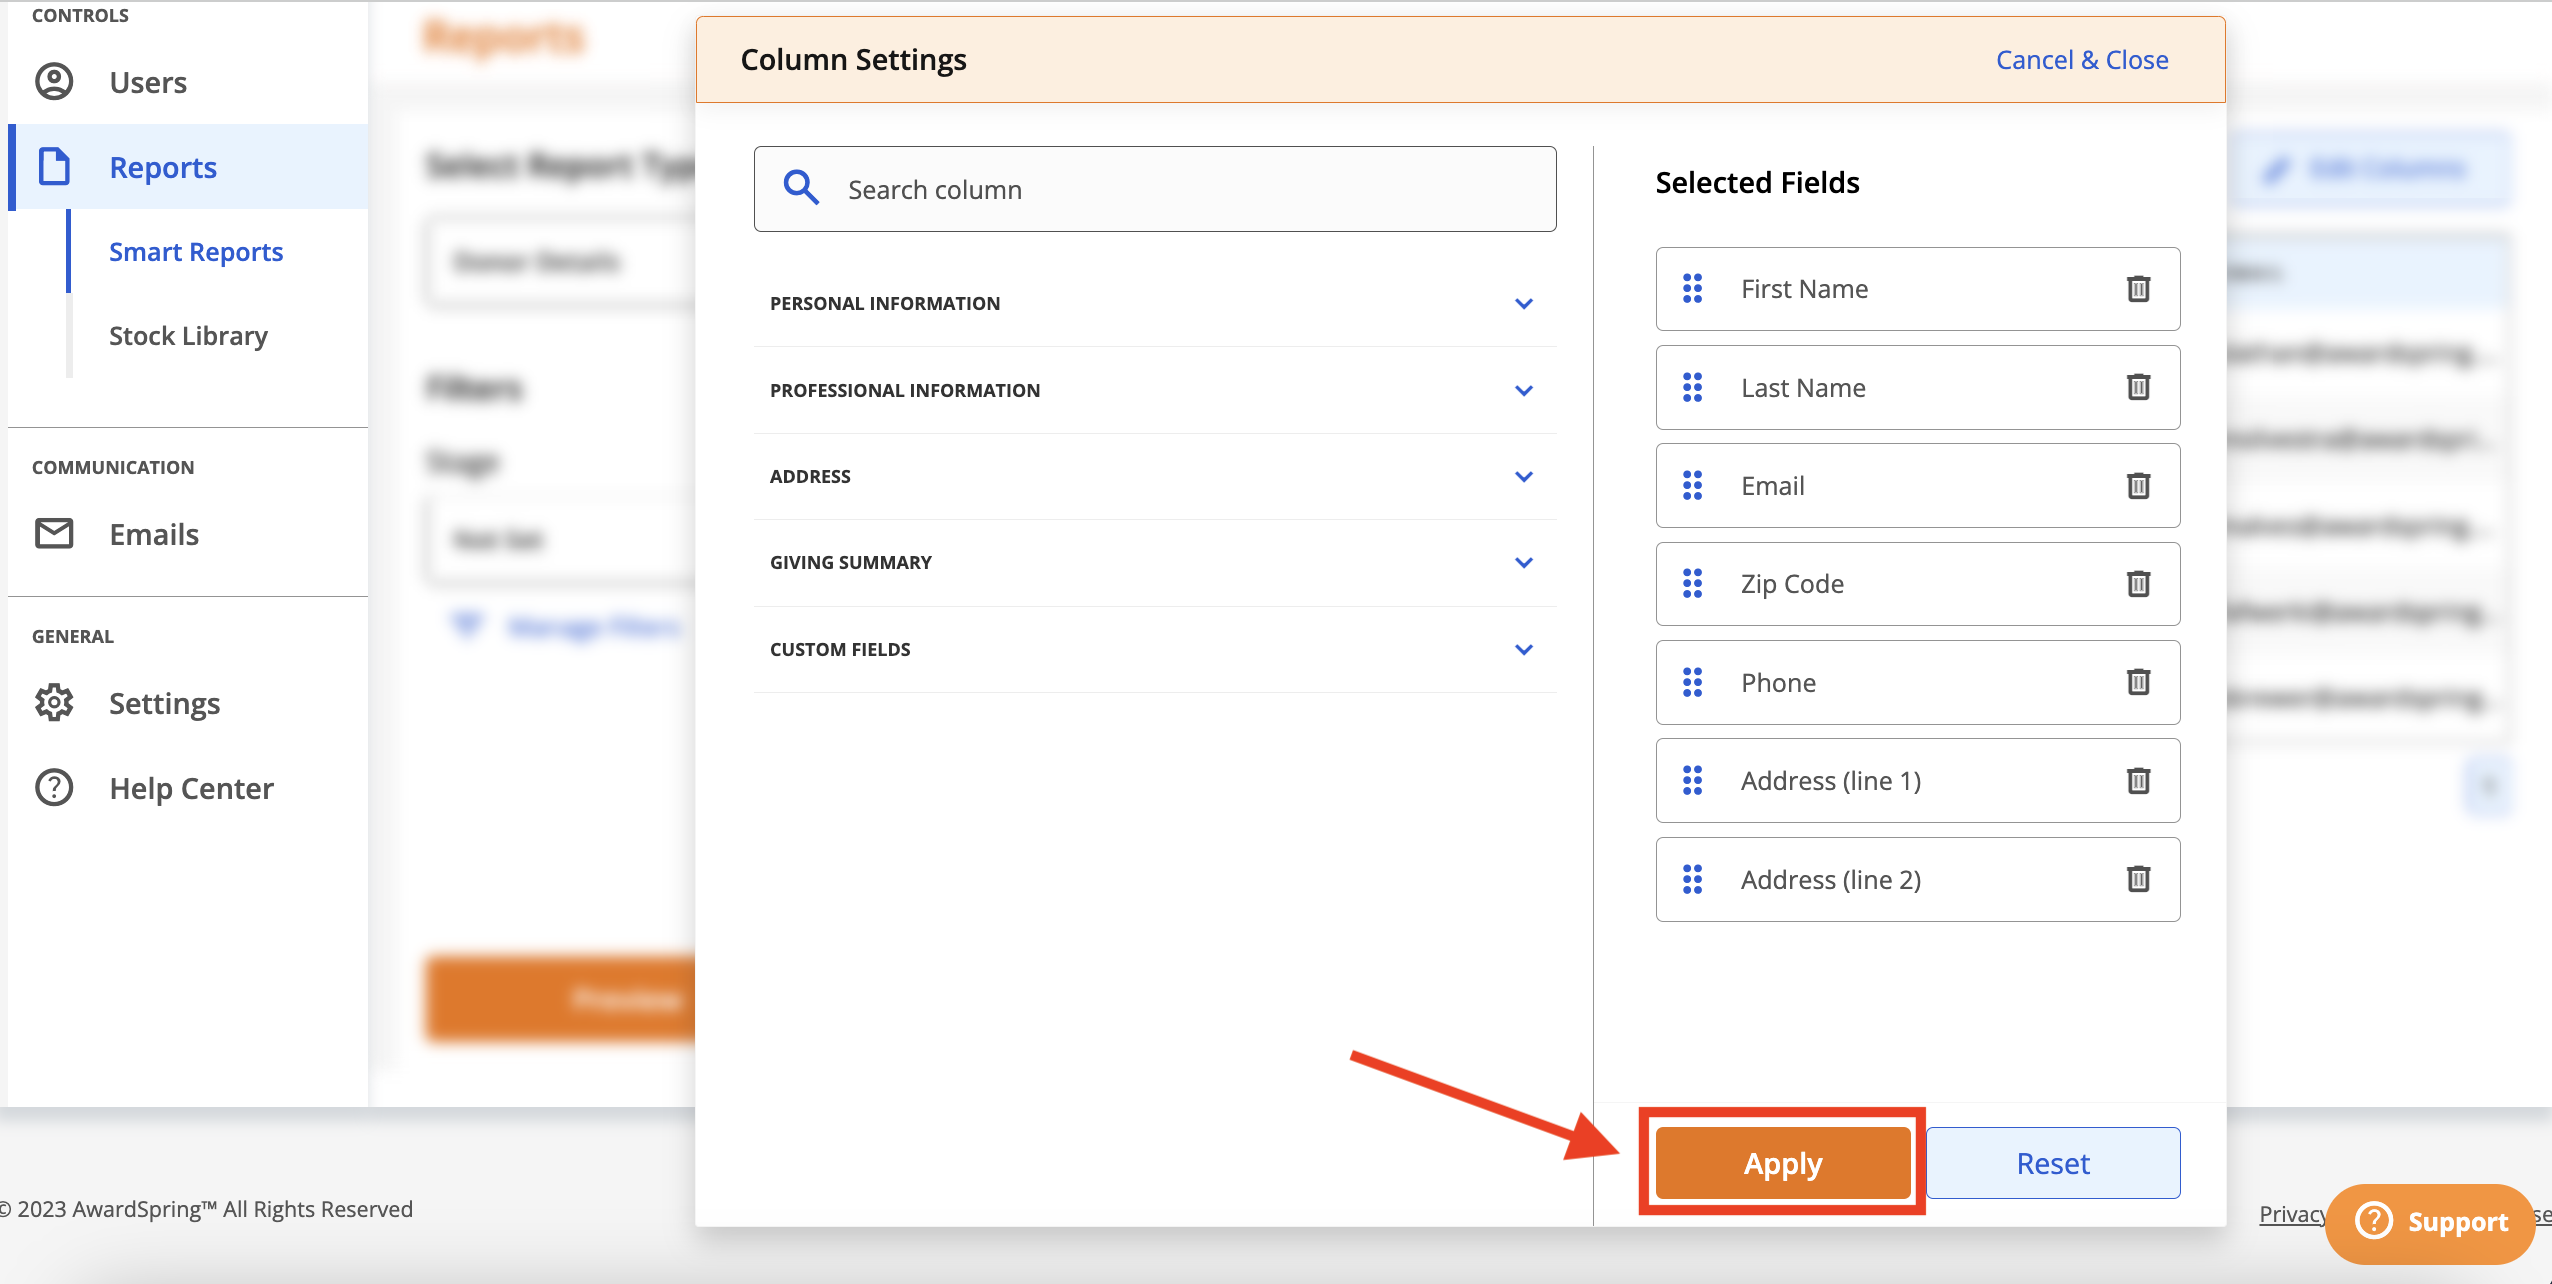
Click the checkbox next to a data point to add it to the report. The data point will appear in the Selected Fields section to the right.
Drag and drop fields to organize them into the desired order.
Use the trash can to remove a data point.
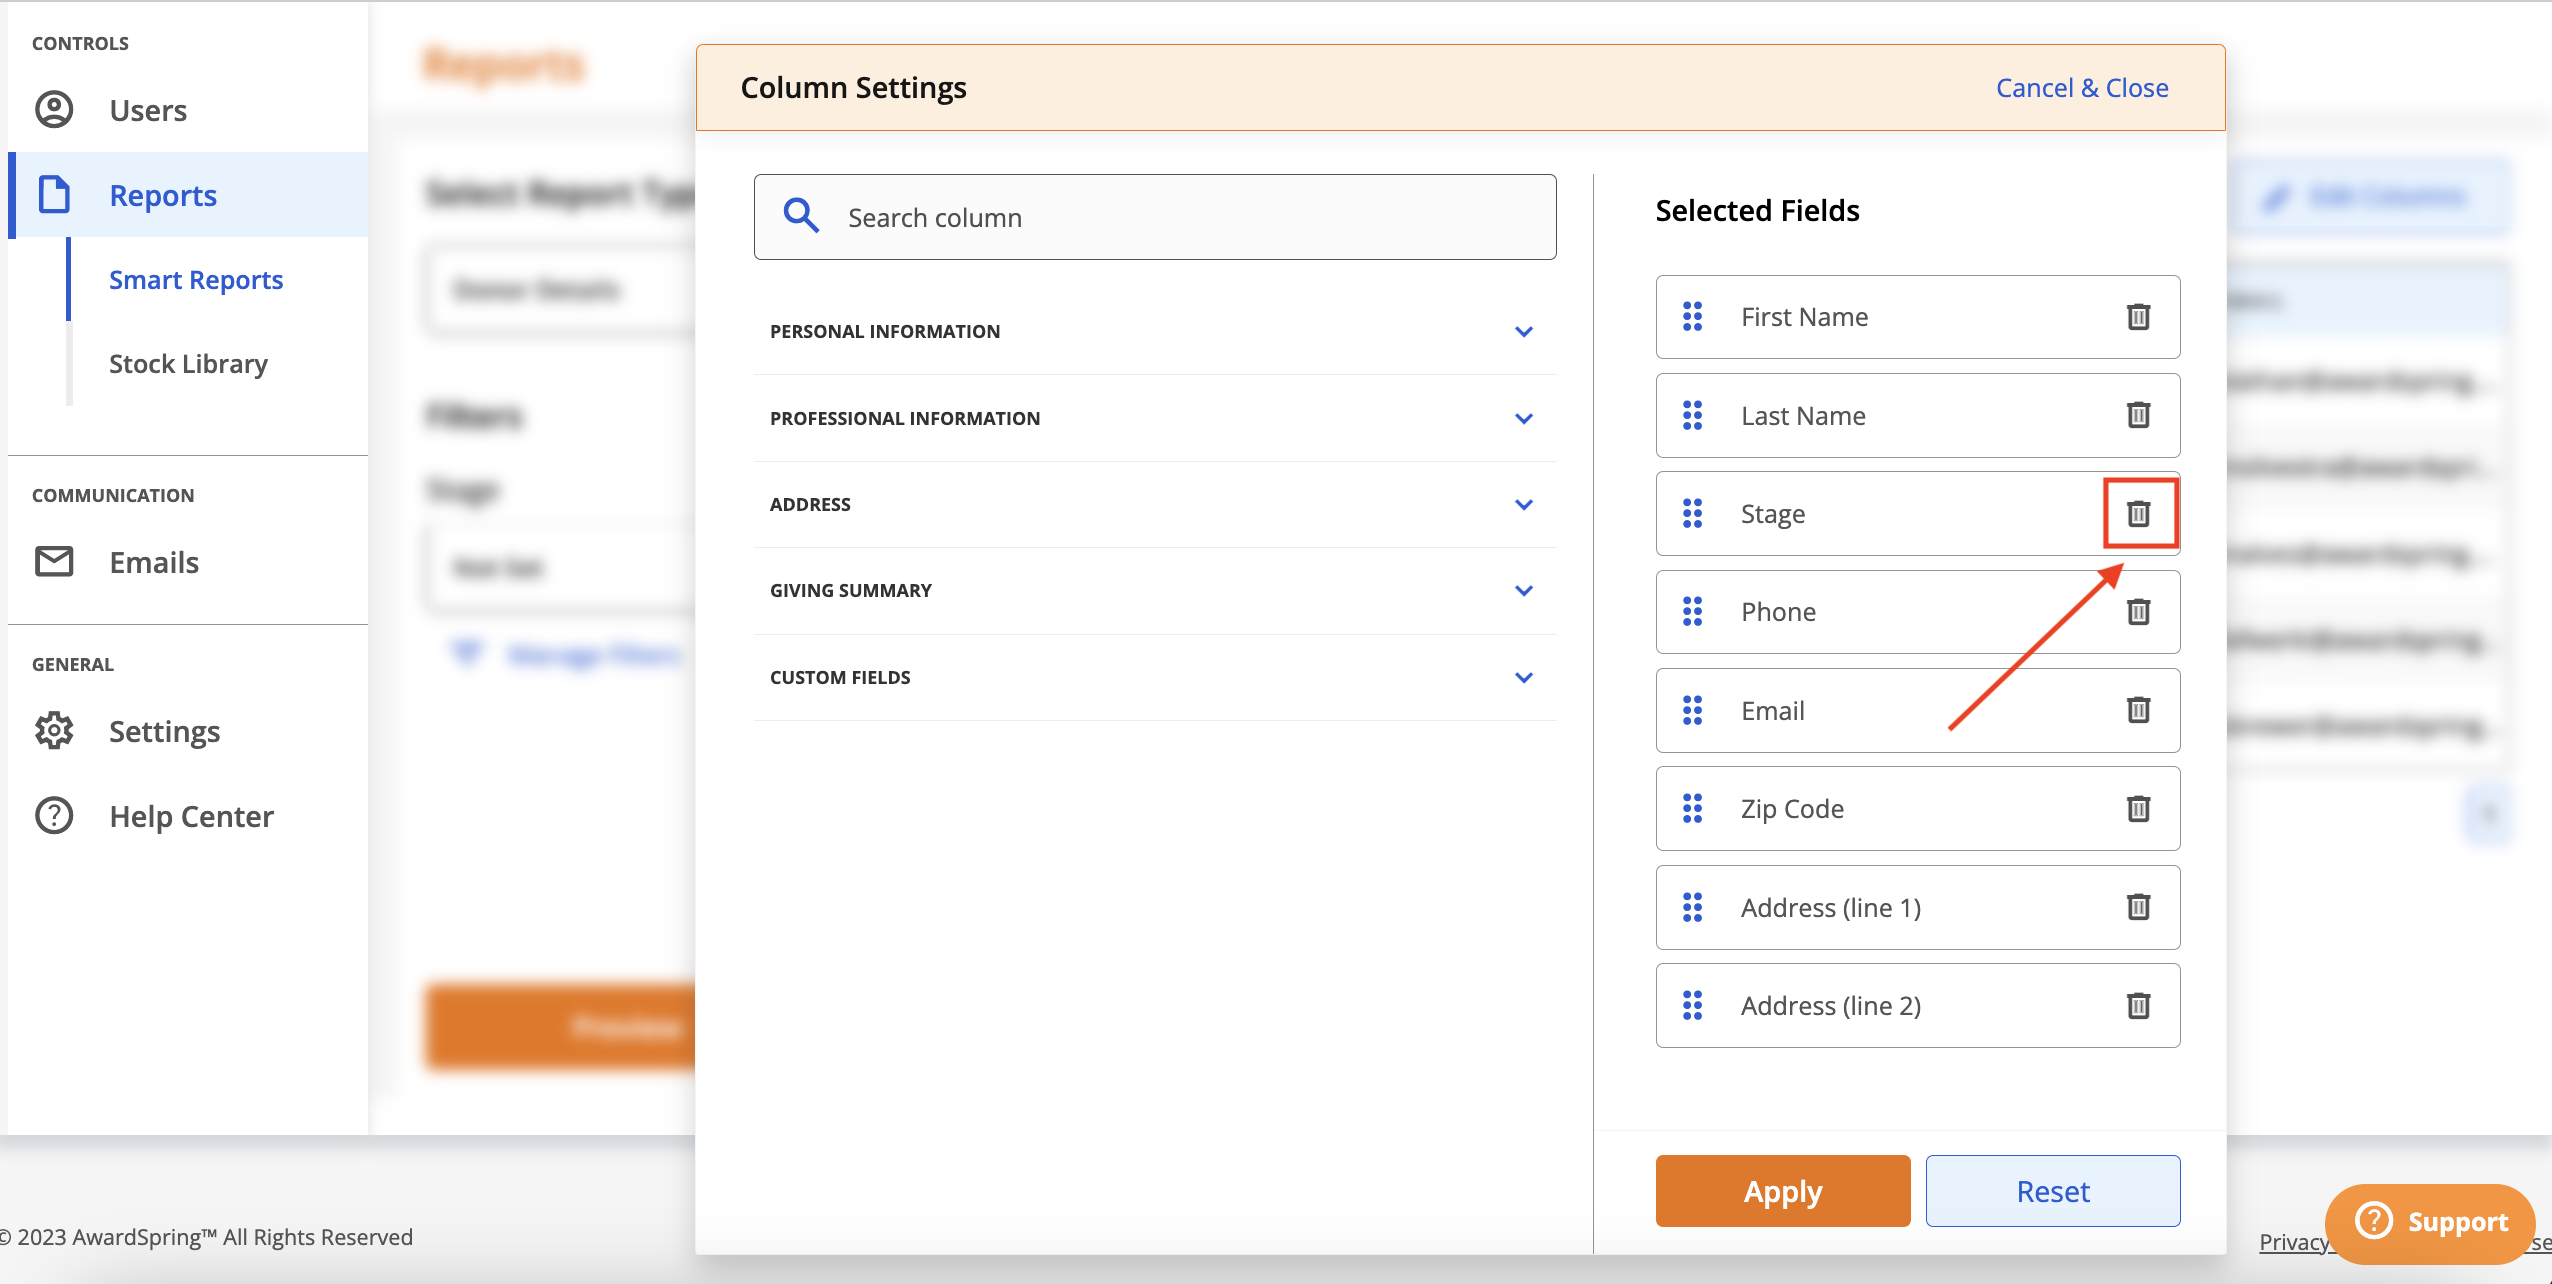
Click Apply to save your changes.
Close the window to be taken back to the report interface.