You can now switch to the new dashboard view by clicking the toggle at the top of the Dashboard page.
The administrative dashboard opens upon logging into AwardSpring as an administrator.
It can also be accessed via the Dashboard tab in the left-hand navigation menu.
The top graph displays information about how many applications have been started vs. completed. A description of each data point is included below.
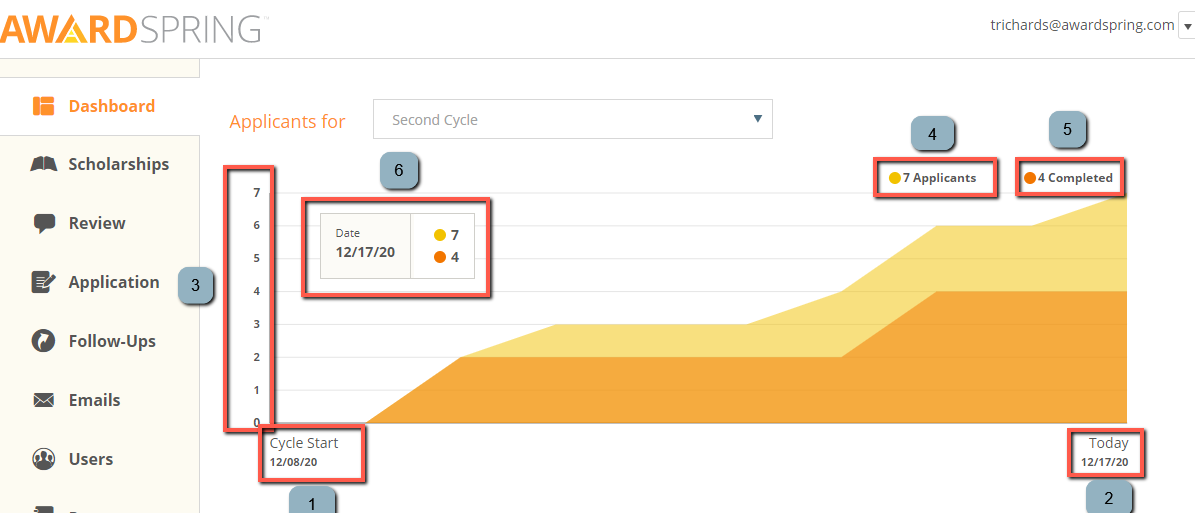
1 – The date that the current award cycle began
2 – Today’s date
3 – The y-axis (applicants)
4 – The number of ‘applicants’, which refers to applicants who have logged in during this award cycle.
5 – The number of applicants who have completed and submitted the general application.
(Note: this number does not indicate unique scholarship applicants; those numbers are displayed in a column on the scholarships tab.)
6 – A dynamic box that shows the number of applicants and number of completed applications for a given day in the current award cycle. By default, data for the current day is shown; simply move the cursor to view statistics for a different day.
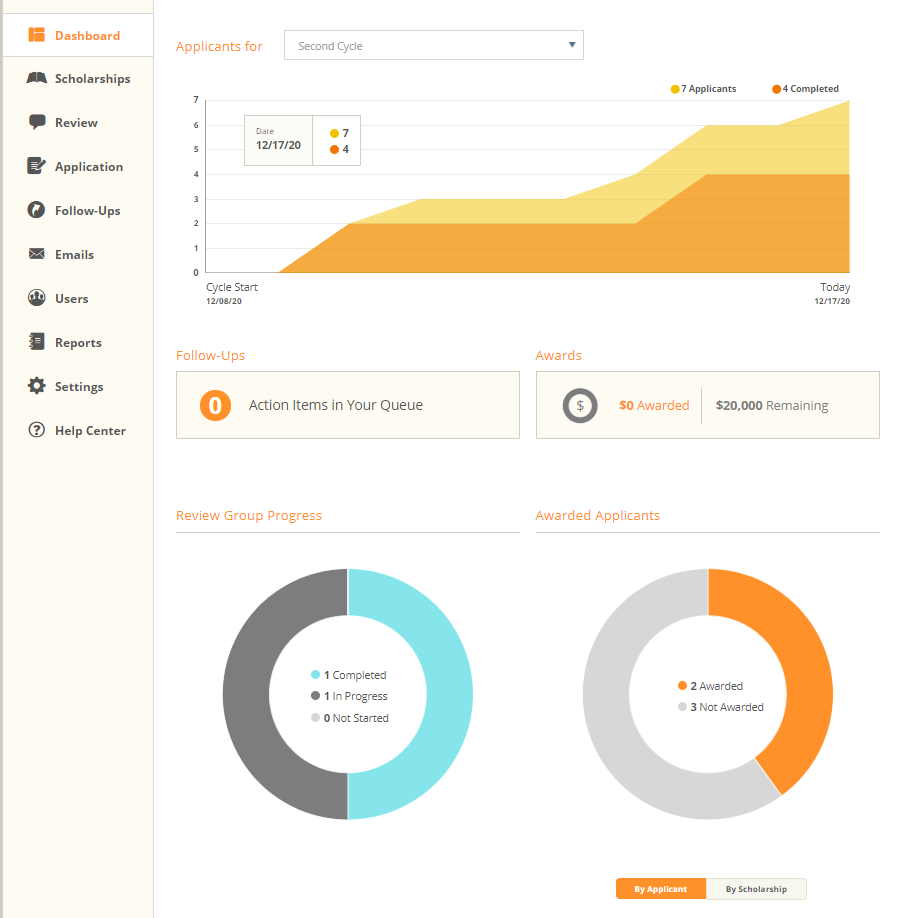
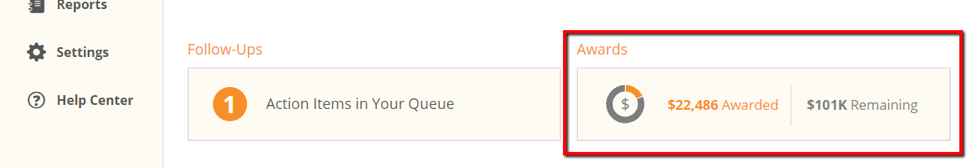
The left middle panel below indicates the number of follow-ups that are in a ‘Take Action’ status, if applicable. Clicking on this box will open the follow-ups queue. For more information about follow-ups, please click here.
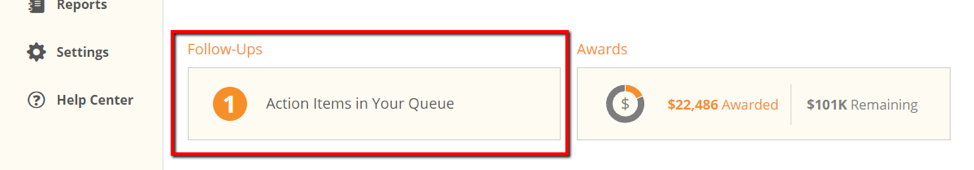
The right middle panel below indicates how many dollars have been awarded to students in the current award cycle, if applicable. The total amount remaining to award is also indicated.
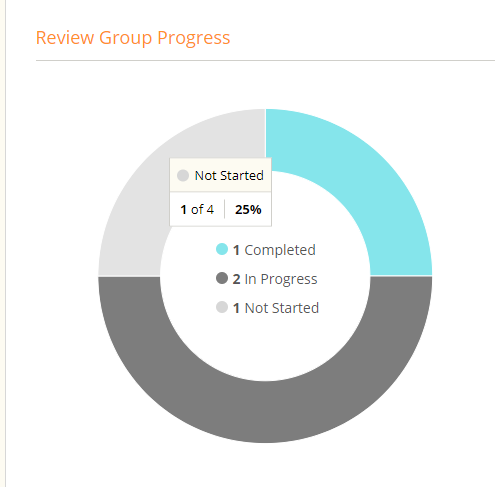
The graphs in the bottom section provide information about review and award progress.
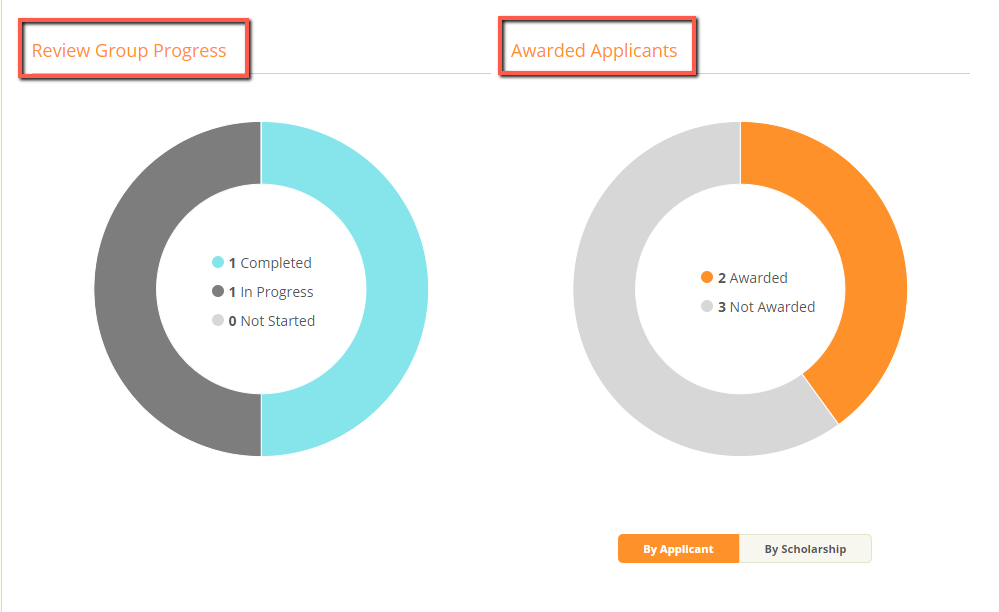
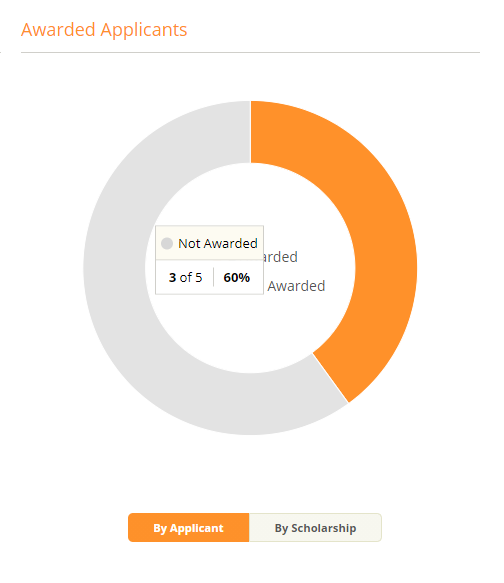
By default, the award information is show ‘By Applicant’.
In the graph on the right, information about how many applicants have been awarded is displayed.
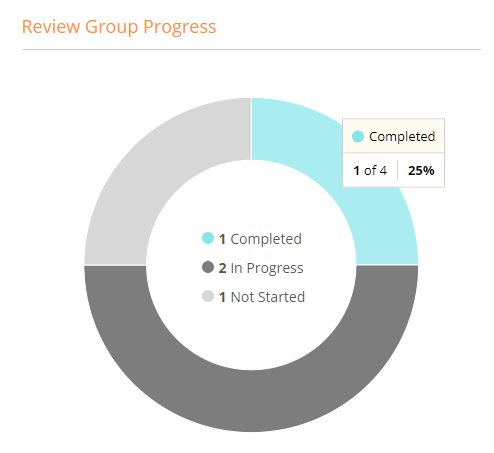
Hover over the light blue part of the ‘Reviewed Group Progress’ graph to view the number of reviews that have been completed out of the total assigned. The percentage is also displayed.
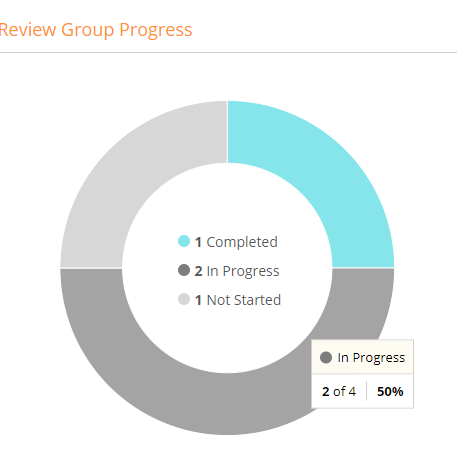
Hover over the dark gray part of the ‘Review Groups Progress’ graph to view the number of reviews that are currently in progress. The percentage is also displayed.
Hover over the light gray part of the ‘Review Group Progress’ graph to view the number of reviews that have not been started. The percentage is also displayed.
Hover over the orange part of the ‘Awarded Applicants’ graph to view the number of applicants that have been awarded. The percentage is also displayed.

Hover over the gray part of the ‘Awarded Applicants’ graph to view the number of applicants that have not been awarded. The percentage is also displayed.
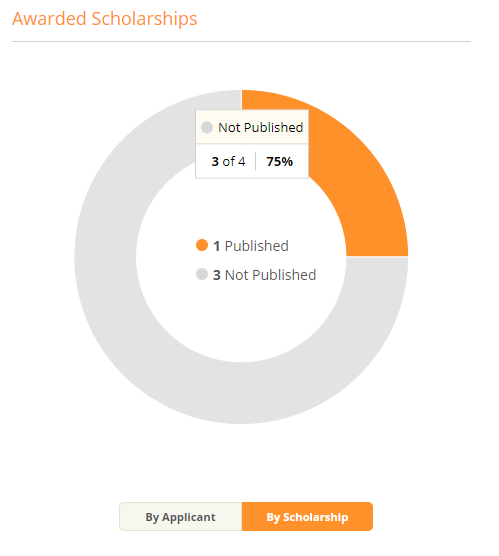
Click on ‘By Scholarship’ to view this information by scholarship.
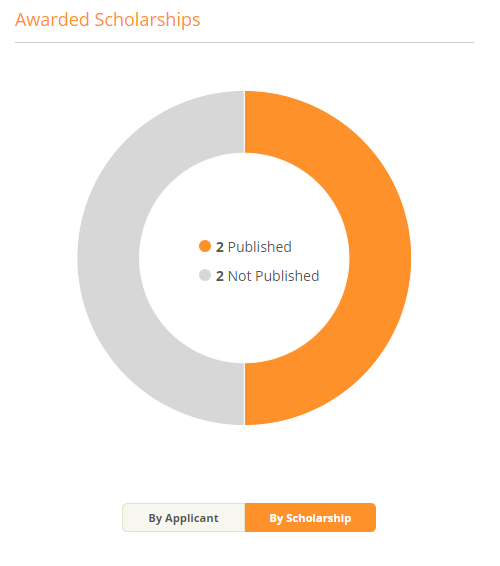
Hover over the orange part of the Awarded Scholarships graph to view the number of scholarships that have been awarded. The percentage is also displayed.
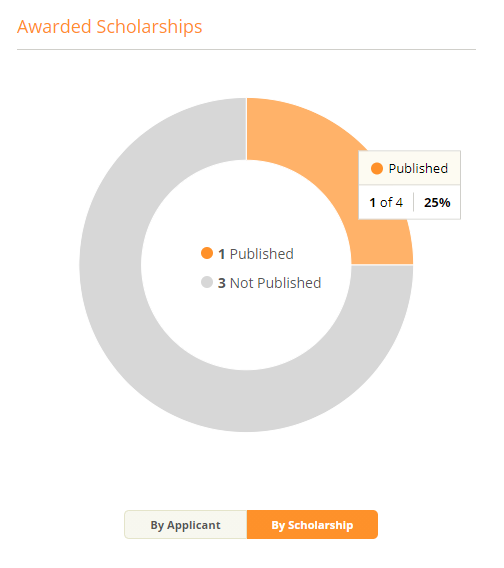
Hover over the light gray part of the Awarded Scholarships graph to view the number of scholarships that have yet to be awarded. The percentage is also displayed.